

TL;DR abstract. When your campaign’s cost per click jumps, it feels like the auction got dearer. But that number blends the prices you actually paid in each country. Even inside one Search campaign, one country’s clicks typically cost about 22% more than the other’s. So the average can rise while no country’s price moves.
Doctor Ads Profit Forensics measured this across its managed portfolio for full-year 2025. In each Search campaign serving several countries, we compared the two highest-spend countries with enough clicks, using prices actually paid rather than a keyword-tool forecast or a country ranking. In the median account, the pricier country’s cost per click was 1.22 times the cheaper one’s, and the middle half of accounts ran from 1.12 to 1.42. We call this gap The Country CPC Split.
Across whole accounts, with every campaign mixed in, the gap is about 2.0, a broader measurement. The practical use is diagnostic: when a multi-country campaign’s CPC rises, check whether clicks shifted toward the pricier country before blaming the auction. The study measures prices, not profit, and does not show that splitting campaigns by country would lower costs.
Your campaign’s CPC is a blend, not a price
Your report gives each campaign one cost per click, and it reads like a price tag. It is an average. Google defines average CPC as cost divided by clicks, so every country the campaign serves pulls on that number in proportion to its clicks.
That gives the average two separate ways to move. A country’s price can change, or the share of clicks coming from each country can change. The report shows both as the same thing: a new CPC.
Most published country comparisons answer a different question. WordStream’s country CPC comparison prices a collection of keywords with Keyword Planner estimates: a market benchmark, with the limits our analysis of average CPC and CTR benchmarks describes. No benchmark can tell you whether your own campaign bought a different blend of countries this month. We measured the click prices campaigns actually paid, inside the same campaign, summarized account by account.
Inside one Search campaign, the pricier country pays about 22% more
The strict result is 1.22: inside the same Search campaign, the pricier country paid about 22% more per click in the median account. A ratio of 1 would mean equal prices. Each campaign’s ratio divides the higher cost per click of its two highest-spend countries by the lower one.
We then took the median within each account and the median across accounts, so one busy advertiser cannot set the headline. Accounts vary: the middle half ran from 1.12 to 1.42, meaning their pricier country paid between about 12% and 42% more.
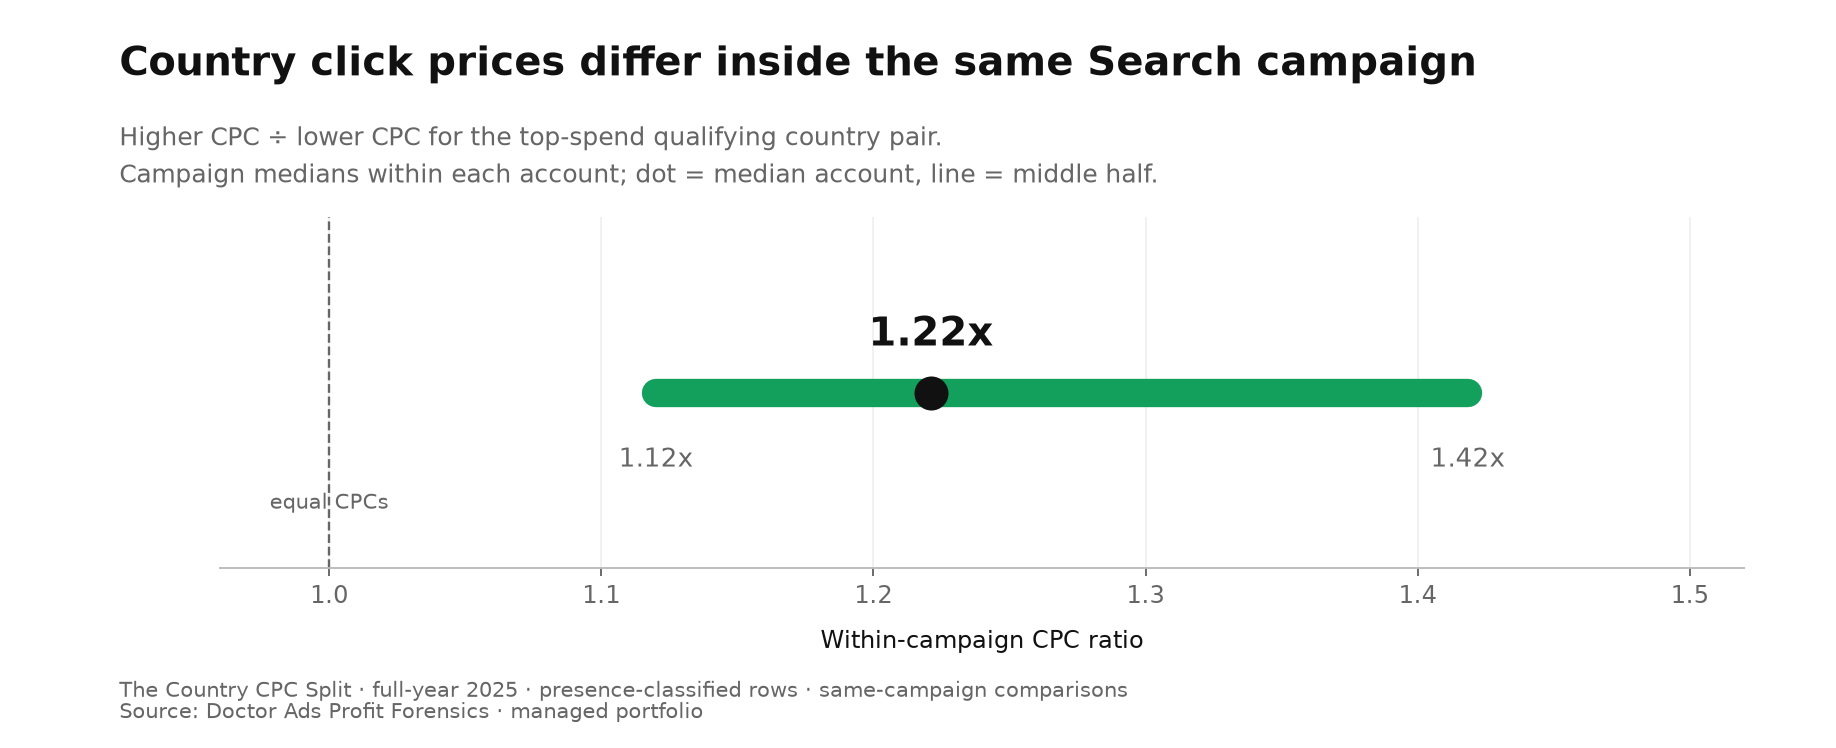
The pairs rest on modest traffic. The country with fewer clicks in each pair had a median of about 200 clicks in 2025, and in half the pairs it had fewer than 200. A few expensive clicks can move a pair that thin, so read 1.22 as the typical size of the gap, not a fixed premium.
One campaign shows 1.22; the whole account shows about 2.0
Drop the same-campaign rule and compare each account’s two highest-spend countries across all its campaigns, and the median ratio is about 2.0 times. In plain terms, the pricier country’s clicks cost about twice as much, a more dramatic number that answers a broader question.
Across a whole account, each country’s clicks can come from different campaigns and campaign types, with different keywords and bidding. The two measurements also cover different sets of accounts, since a country can gather enough clicks across an account without doing so inside any single Search campaign.
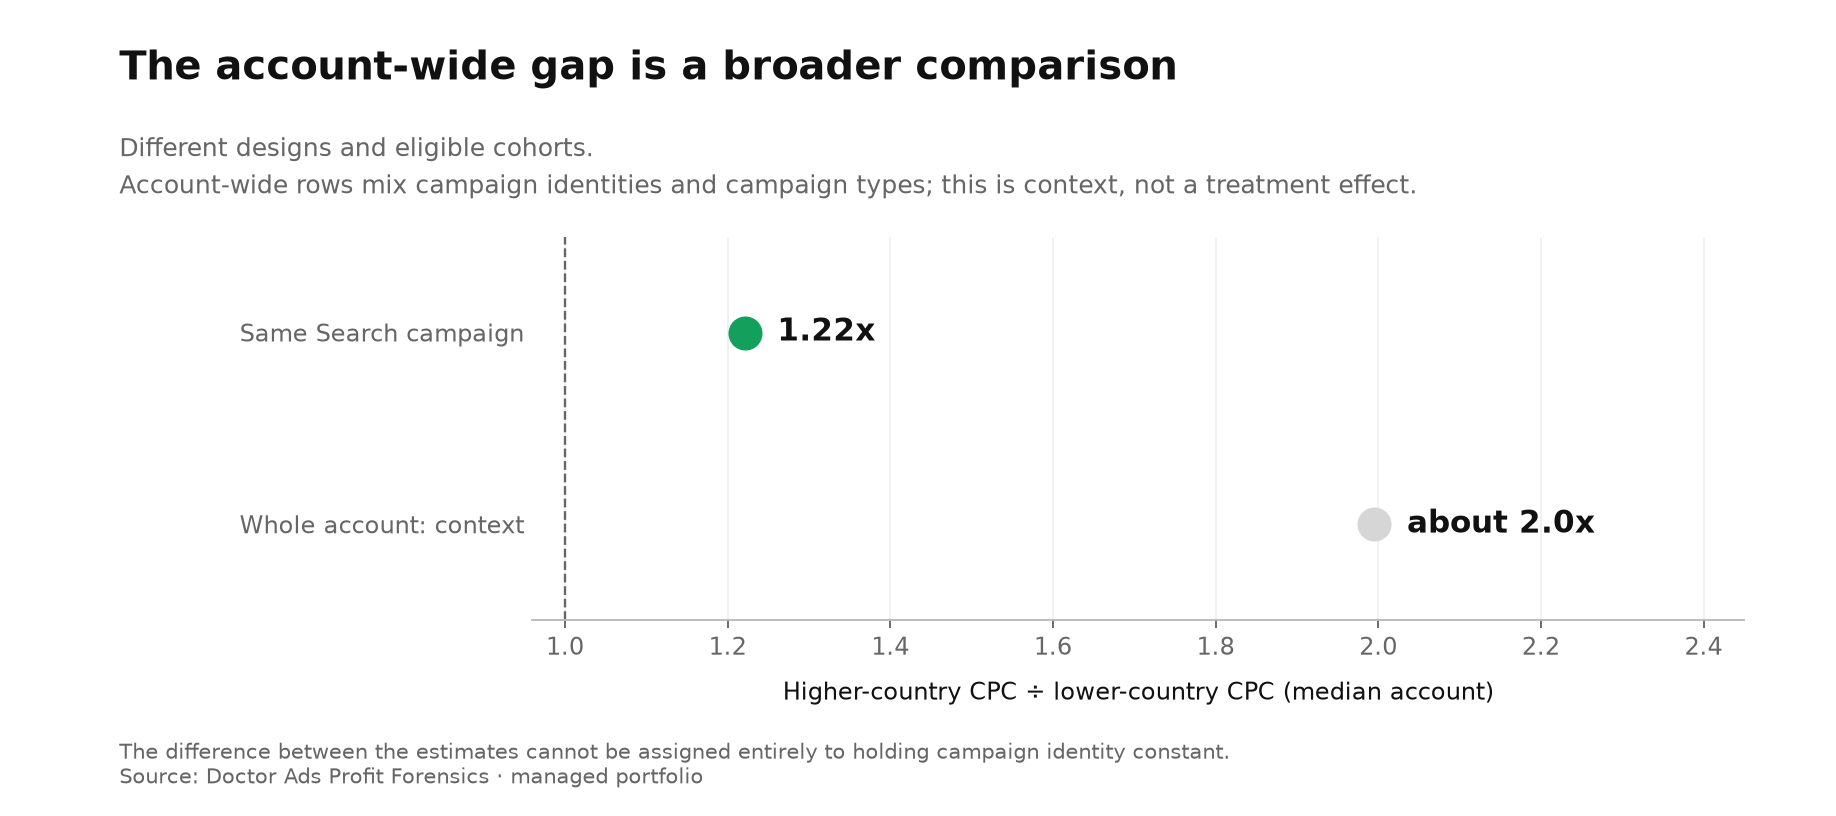
So the step from about 2.0 down to 1.22 cannot be credited to any single factor, holding the campaign fixed included. The stricter design shows something narrower: a gap remains even when the campaign is the same.
The same campaign is not the same auction
Holding the campaign fixed removes one mixing problem, but it does not make the searches identical. Each country’s row can hold different queries, devices, hours and competitors. Google’s Ad Rank documentation counts your competition and the context of the search among the inputs, including “the person’s location at the time of the search.”
Bidding adds a second layer. Google’s Smart Bidding documentation describes bids set at auction time using signals that include location. A campaign can rationally pay more in one country if the system expects better conversion outcomes there.
Each of these is a plausible route to two prices inside one campaign. This data does not show which route produced any particular gap, or whether the bidding system’s expectations were right, so treat a gap as the start of an investigation rather than its end.
When your CPC rises, check the country mix first
The split matters most on the day your campaign’s CPC goes up. Because each country carries its own price, the average moves whenever the share of clicks moves, even if every price stays put.
Here is an example with made-up round numbers, not figures from our dataset: clicks cost $1.00 in one country and $1.20 in the other, close to the typical gap. In March, 80% of the campaign’s clicks come from the cheaper country, so the campaign CPC is $1.04. In April the split is 50/50, and the campaign CPC is $1.10, a rise of about 6% with no change in either country’s price. Read that as inflation, and you might tighten targets or budgets in response to a rise no auction caused.
The mix can even run against the prices. If both countries got slightly cheaper while clicks moved toward the pricier one, the campaign CPC could still rise. Statisticians call that reversal Simpson’s paradox: every part moves one way, and the total moves the other.
Another agency found the same effect at portfolio scale. In PPC Geeks’ Q3 2026 UK spend report, click prices fell for the accounts present in both years, yet the blended average across its whole book rose. The agency called that rise “a mix artefact, not a market price.” Its mix was client accounts; yours can be countries.
A mix shift is not automatically bad news. Under Smart Bidding, extra clicks from the pricier country may be what the strategy chose to buy, so judge them by what they produced. The checklist below shows how to split a rise into mix and price.
A cheaper click is not a reason to move the budget
The price gap helps you read the report; it does not choose the market. A dearer click can bring better customers, and a cheaper one can bring traffic worth little.
| What you see | What to check next | What the price alone cannot decide |
|---|---|---|
| Campaign average CPC changed | Country prices and their click shares | Whether the auction got dearer everywhere |
| Country CPCs differ within a campaign | Query mix, device mix, timing and bidding context | Which factor caused the difference |
| A country buys cheaper clicks | Confirmed outcomes and their economic value | Whether more budget there produces more profit |
| You are considering separate campaigns | The control you need and the result to test | Whether separation would lower CPC |
Before moving budget or splitting a campaign, tie each country’s price to confirmed outcomes and margin. Decide in advance what result would count as success.
When this does not apply
Only one country brings real volume. There is no pair to compare inside the campaign. Comparing countries across unrelated campaigns answers the broader account-wide question instead.
One country has very few clicks. A handful of expensive clicks can swing its price. Dividing the higher price by the lower also means two thin rows show a gap even when the true prices match, so use a longer window before trusting it.
The rows mix presence and interest. Google’s geographic reporting guide separates targeted locations from matched locations, which can reflect where people are or what they showed interest in; our presence-versus-interest study covers the difference. Compare like with like. This study used presence rows only, which are Google’s classification, not a verified physical location.
The campaign changed between the periods. New keywords, a new bid strategy or an edited location list can move the mix and the prices at once, so compare periods with the same setup.
Your decision is about profit. Add customer quality, revenue and margin by country. The cheaper country can be the worse investment, and price alone cannot tell you which one deserves more money.
What to check in your account
- Pick a Search campaign that serves more than one country, and two periods to compare, such as last month and this month.
- Open the campaign’s location report for both periods with the same location view in each. If you can separate presence from interest, keep presence rows only.
- For each country, divide cost by clicks for its CPC, and its clicks by the campaign’s clicks for its share. Start with the two highest-spend countries, not the most extreme prices. Use all countries when you rebuild the campaign average.
- Separate the mix from the prices. Rebuild this period’s average at last period’s prices: multiply each country’s earlier CPC by its current click share and add them up. The move from last period’s CPC to that figure is the part the mix explains; the rest came from prices.
- If the mix moved, check what the extra clicks from the pricier country produced in confirmed conversions and value before treating the rise as a problem.
- If one country stays dearer period after period, look at its queries, devices and hours, then connect the gap to outcomes before changing budget or structure.
Researcher’s take
When a campaign’s cost per click goes up, I would open the location report before touching the bid strategy. The campaign average is a blend, and a blend can move without a single price moving. What makes this finding useful is where it shows up: inside one Search campaign, the place an average looks most like a single price.
That earns the country rows a regular look. It does not earn a budget transfer or a restructure on its own. My verdict: read a rising CPC as a question about mix first and price second, and let outcomes, not click prices, decide where the money goes.
Igor Ivitskiy, Doctor Ads Profit Forensics
FAQ
Why does CPC differ between countries in the same campaign?
Each country’s clicks come from its own auctions, where searches, competitors, devices and timing can differ, and Smart Bidding uses location as a signal. In the median account, the pricier country paid 1.22 times the cheaper one’s CPC, about 22% more. This data cannot say which factor drives a given gap.
Why did my campaign’s CPC rise when no country got more expensive?
Average CPC is cost divided by clicks across all the campaign’s countries, so a bigger share of clicks from the pricier country raises it on its own. Rebuild the average at last period’s prices to see how much the mix explains.
Does the finding tell me to split campaigns by country?
No. The 1.22 ratio describes an observed difference in click prices. It does not measure what splitting would do, or which country brings better customers.
Is the campaign-pair average the same as the account median?
No. The mean of all campaign-pair ratios was 1.62, against the 1.22 account median. The mean gives more weight to accounts with more pairs and to larger gaps, and neither figure is total cost divided by total clicks.
Method
Data come from a 10 July 2026 snapshot of the managed portfolio, with one account refreshed in September 2026; no account is counted twice. The strict cohort is n = 11, contributing 38 campaign pairs; with a cohort this small, the leave-one-account-out range below shows how far one account can move the result. The performance window is full-year 2025, so the refresh adds no new months. This is a managed and audited agency portfolio, not a random sample of advertisers.
Country totals use presence-based location rows with positive spend and at least 100 clicks in each country. For each Search campaign, we take the two highest-spend qualifying countries, compute each CPC as cost divided by clicks, and divide the higher by the lower; medians run first within each account, then across accounts. Both CPCs share the account currency, so a common conversion factor cancels in their ratio. The broader comparison, n = 23, applies the same pair rule to each whole account, combining campaign identities and types.
Leave-one-account-out headline ratios range from 1.215 to 1.296; excluding the largest account by spend gives 1.215, and keeping only the largest account from each group of related accounts leaves the result unchanged. The thinner country in each pair had a median of 196 clicks, 19 of the 38 pairs fell below 200 on that side, and only four pairs had at least 1,000 clicks on both sides. Giving every pair equal weight produces a median ratio of 1.34 and the mean of all pair ratios is 1.62, so the headline account median is the lowest of the three summaries. Joins are checked for duplicate keys, and reruns reproduce the same figures.
Campaign type comes from the snapshot and may not describe all of 2025, and current status is not used as a historical filter. Queries, devices, timing, bids and other differences within a campaign remain uncontrolled, so the ratio is an observed price difference, not the effect of geography alone. Conversions are not pooled or compared across accounts, and profit and restructuring effects were not measured. Doctor Ads Profit Forensics publishes no country, client, brand or niche identifiers, and these findings do not guarantee a business result.

