

TL;DR abstract. Did Google Ads click-through rates really fall in 2025, or did account averages just shift? Doctor Ads Profit Forensics held the keyword fixed: the same keyword in the same ad group, inside each account, in 2024 and again in 2025. The median account’s ratio was 0.75: the same keywords lost about a quarter of their click-through rate, and the drop showed up in all but one account. In most accounts those keywords got fewer clicks, often alongside more impressions.
The year before shows nothing similar: from 2023 to 2024 the same-keyword click-through rate rose about 5%. Month by month, in Search campaigns that ran in both years, the drop starts in the winter of 2024 to 2025 and is deepest from April to October 2025, when the median account sat 26% to 32% below the same month a year earlier. The first half of 2026 was still well below the first half of 2024. It shows up with and without search partners and on both mobile and desktop. The median conversion rate of the remaining clicks stayed near its 2024 level, and in hard currencies the price of the same click barely moved. This data cannot say what caused the drop.
If your click-through rate fell in 2025, you have probably heard two explanations. One says the market moved: AI answers on the results page take clicks that used to go to ads. The other says nothing moved at all, because the big benchmark reports show a flat or rising average. Both are said with confidence, and they cannot both describe your account.
The published record splits along the same line. Samples, markets and time windows differ between these studies, and so does what each one holds fixed. Seer Interactive’s September 2025 update, published in November, followed 3,119 informational search terms from forty-two client organisations and found paid CTR down 68% from June 2024 to September 2025 where an AI Overview appeared, and down 32% where none did. Its April 2026 update, on a much larger query set, found paid CTR without an AI Overview about 16% lower in February 2026 than in January 2025, and paid CTR with one slightly higher. Tinuiti’s Q4 2025 benchmark, built on clients present in both years, reports “pretty significant declines in text ad click-through rates” against early 2024, more than offset by impression growth, so its clicks still rose.
One agency has already published the drop at portfolio level. OpenMoves reported its first-quarter Search CTR at 10.53% in 2024 and 5.52% in 2025, raw figures from its own client accounts with no adjustment for changes in which clients it ran, as it says itself.
On the other side, WordStream’s 2026 benchmarks put the average, a median across campaigns, at 6.64% against 6.66% a year earlier and add that their own clients saw “fairly stable CTRs” in contrast to the market. Optmyzr’s Q1 2026 report (its Spanish edition carries the full table) has pooled Search CTR up 14.7% year over year, with impressions down. A pooled average can rise while every keyword in it falls, if the low-CTR impressions drop out of the pool. A changing mix of keywords and clients is one possible way to reconcile them. None of these studies holds the keyword itself fixed inside an account and reports how many accounts moved. That is what we measured.
The same keywords lost about a quarter of their click-through rate
For each account we took every keyword that ran in both 2024 and 2025 in the same ad group, with at least 30 clicks in each year, and kept accounts with at least ten such keywords. We weighted each keyword by its 2024 clicks, so the comparison is a fixed basket: the same keywords, in the same proportions, one year apart. The result is a click-weighted CTR index of those keywords, not the account’s ordinary CTR.
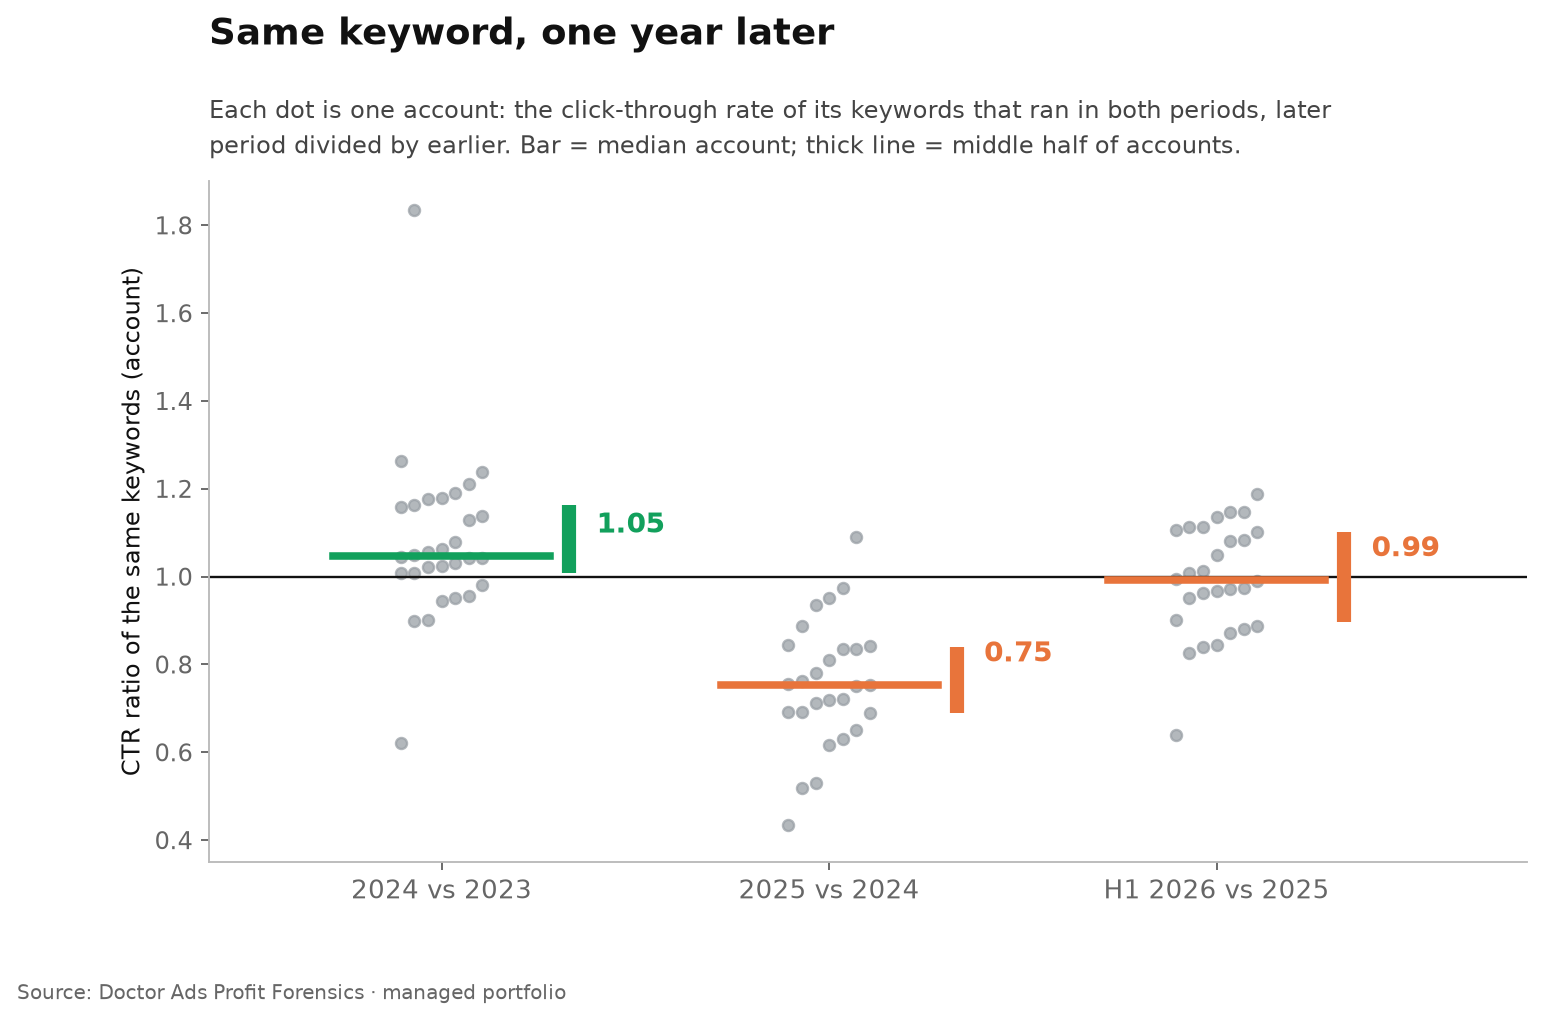
The median account’s CTR ratio was 0.754, with the middle half of accounts between 0.69 and 0.84. Leaving out any one account moves it by a thousandth. The ratio fell below 1 in all but one account; the highest was 1.09 and the lowest 0.43. The drop does not belong to one market either: accounts billed in hard currencies sit at 0.76, all but one of them below 1, and accounts billed in Ukrainian hryvnia at 0.72, every one of them below 1.
Fewer clicks, and often more impressions
The arithmetic matters, because a CTR can fall for opposite reasons. In the median account the denominator grew and the numerator shrank, but the two moves did not always come together. Across accounts, the median impression ratio of the same keywords was 1.15 and the median click ratio 0.85. Clicks fell in about three accounts in four, impressions rose in just over half, and both happened at once in about three in ten. In those accounts the drop was extra impressions that people did not click. That differs from Tinuiti’s advertisers, whose clicks still grew because impressions grew faster, and it is close to the pattern Seer warns about in its 2026 update: an impression surge can drive a CTR drop with no change in what a searcher does with a given ad.
The year before shows nothing of the kind
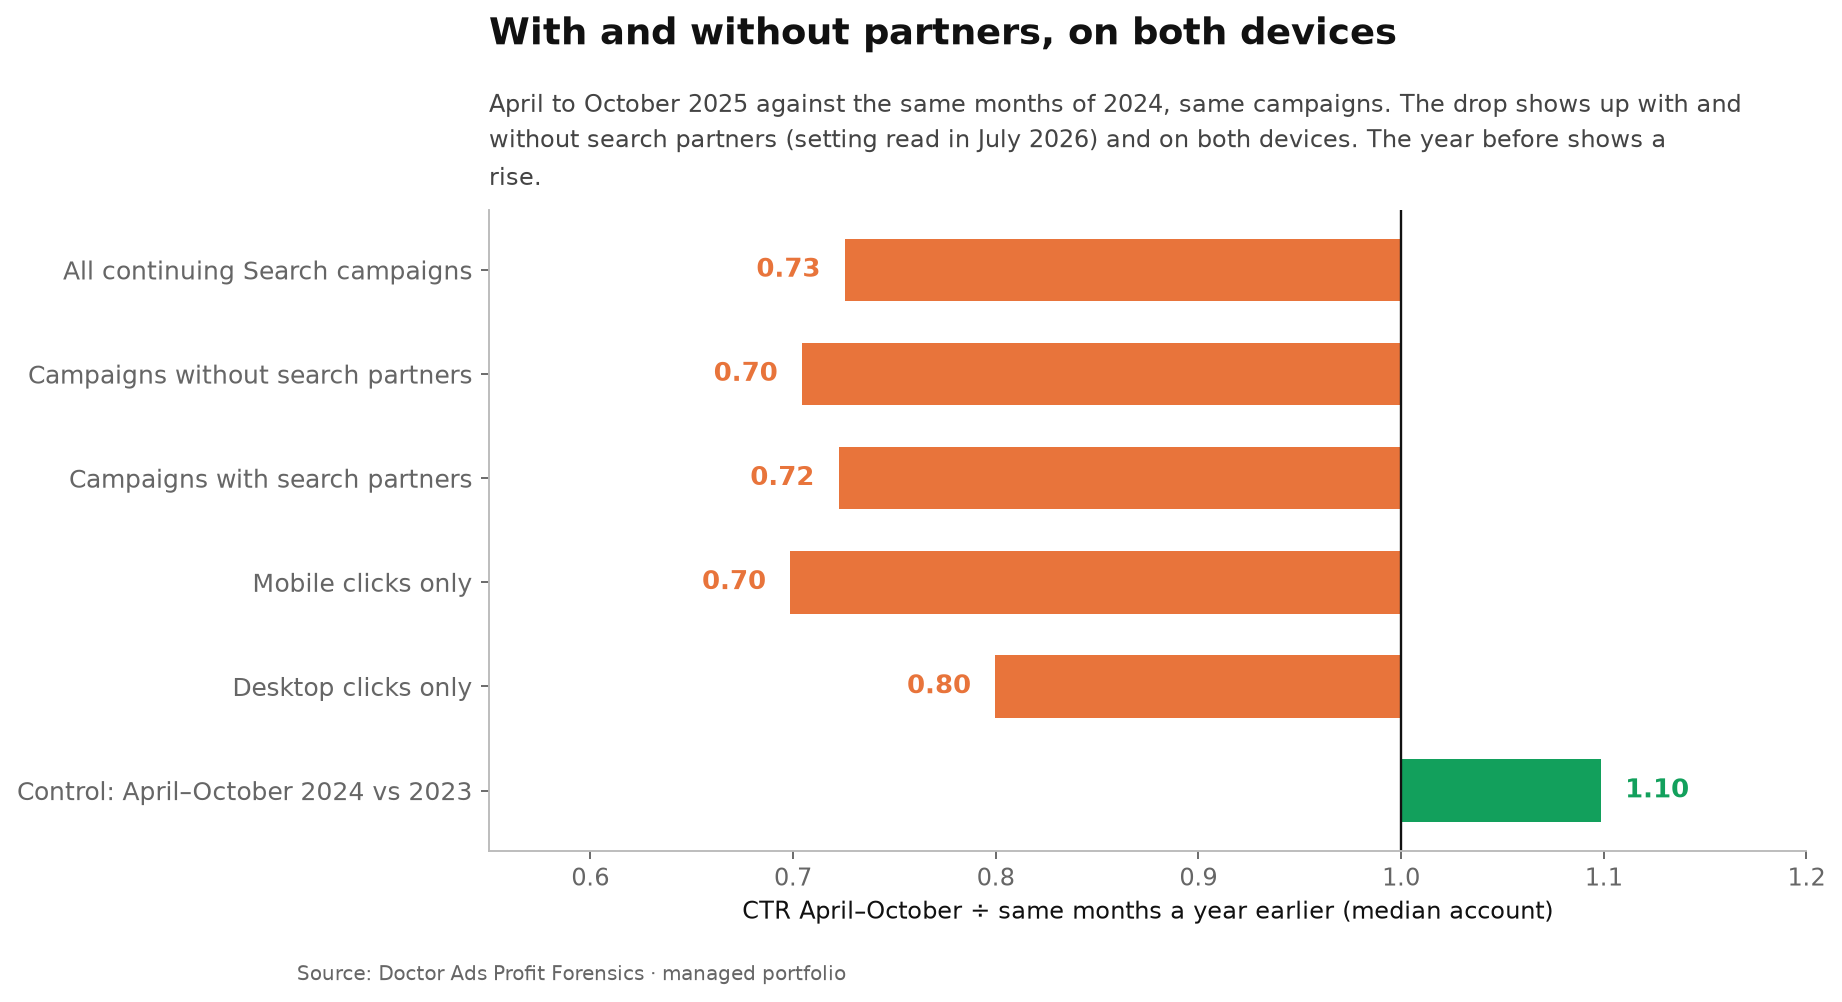
A fixed basket can drift for reasons that have nothing to do with the year: keywords age, competitors arrive, ads get rewritten. So we ran the same comparison one year earlier. From 2023 to 2024 the median account’s same-keyword CTR ratio was 1.047, and it fell in only about one account in four. In the monthly campaign data, April to October 2024 against the same months of 2023 gives 1.10. Whatever pushed CTR down in 2025 was not there a year before.
It started in the winter and was deepest from April to October 2025
Yearly windows hide the timing, so we turned to monthly data. For every Search campaign that ran in both years, we compared each calendar month with the same month a year earlier, required at least 50 clicks in both months, and took the median across accounts.
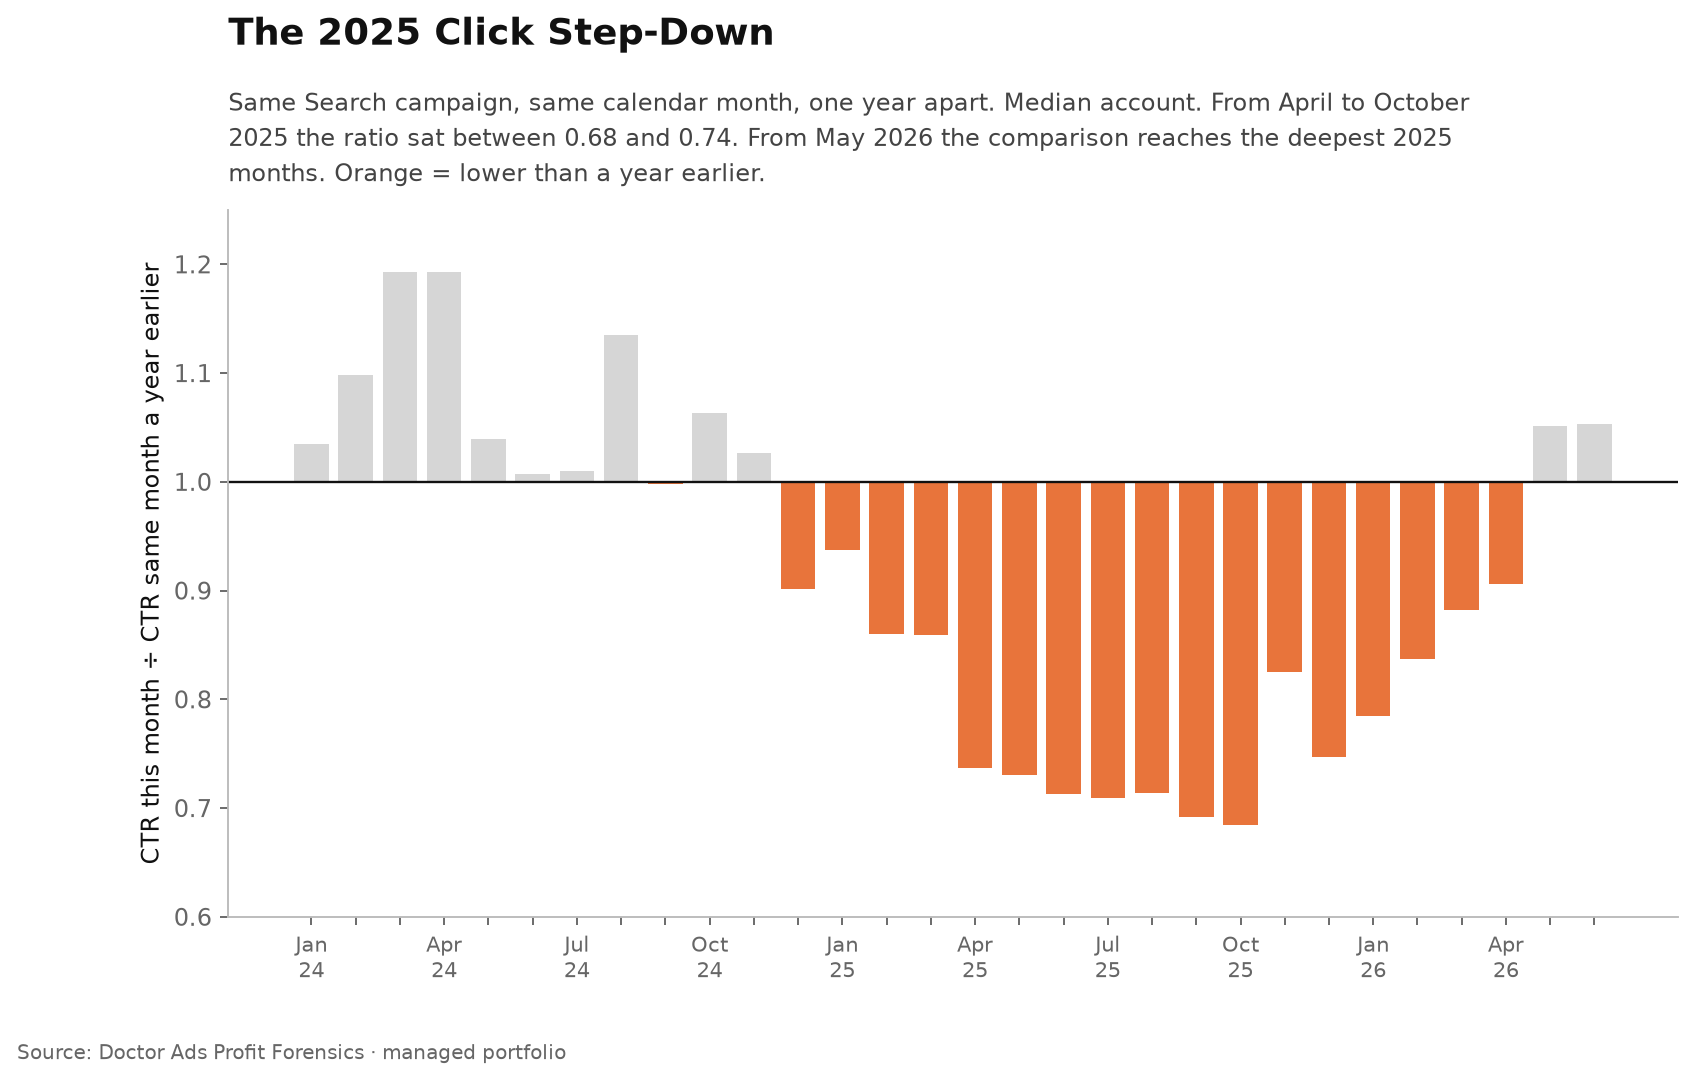
Through most of 2024 the ratio sits near or above 1. It first drops clearly below 1 in December 2024, at 0.90, slides through the first quarter of 2025 and stays between 0.68 and 0.74 from April to October 2025. Taken as one window, April to October 2025 against April to October 2024 gives a median account ratio of 0.726, lower in about nine accounts in ten, and at least 20% lower in two accounts in three. Pooled across all clicks and impressions the ratio is 0.72, and 0.63 without the largest account.
The lower level is still there in 2026
From May 2026 the monthly bars turn grey again: the ratio is back above 1, which looks like a recovery. Every 2026 month is compared with a 2025 month, and from May the comparison reaches the deepest 2025 months, so a ratio above 1 there means only that 2026 is no lower than the trough. Comparing two years apart answers the real question. The first half of 2026 against the first half of 2024 gives a median account ratio of 0.728, lower in about eight accounts in ten. Against the first half of 2025 it is 0.90, lower in about two accounts in three, because January to March 2025 came before the deepest months. On the same-keyword baskets, the first half of 2026 against the whole of 2025 sits at 0.99. CTR in 2026 is still well below 2024; whether it has stopped moving, these windows cannot say.
The drop shows up with and without partners, and on both devices
Two mundane explanations would make this a reporting quirk rather than a market change. The first is search partners: partner sites show ads far more often than they get clicks, so more partner traffic would cut CTR with no change on Google itself. In the April to October window, campaigns whose partner setting was off fell just as hard, to a median ratio of 0.70, in nearly nine accounts in ten. Campaigns with partners on came in at 0.72. The partner setting is read from the July 2026 snapshot, so a campaign may have run with partners on in 2024 or 2025.
The second is a shift towards mobile, where CTR behaves differently. We compared the same campaign on the same device in the same month. In the same window, mobile fell to a median ratio of 0.70 and desktop to 0.80, both in more than eight accounts in ten. Mobile fell further, but desktop fell too, so a shift between the two devices alone cannot explain the drop. These two checks weaken the simplest explanations; they do not rule out every contribution from partners or devices. Our own count of how much of the typical account’s spend already runs on mobile puts that share near four fifths.
Conversions per click barely moved
A falling CTR is sometimes read as good news: if the searchers who stopped clicking were the ones who never bought, the remaining clicks would convert better. In these accounts the remaining clicks converted at about the same rate as before. On the same keywords, the conversion rate in 2025 against 2024 had a median ratio of 1.02, with the middle half of accounts between 0.95 and 1.14, higher in about half of them and lower in the rest. On that same group of accounts, clicks fell to a median 0.88 and conversions to 0.91. We cannot see who stopped clicking, so this says nothing about whether the missing clicks would have converted. It says the clicks that remained did not become more valuable to make up for the lost volume.
The price of the same click barely moved in hard currencies
Fewer clicks did not come with a matching price story. In accounts billed in dollars, euros, pounds and other hard currencies, the median cost-per-click ratio of the same keyword was 0.95 from 2023 to 2024, 1.06 from 2024 to 2025 and 1.01 from 2025 to the first half of 2026. Across these pairs there is no steady rise, which is in line with Tinuiti’s text-ad cost per click, up 2% in Q4 2025. For the spread of CPC levels between accounts, rather than their change over time, see our benchmark corridor of average CPC and CTR.
Alphabet’s own filings are coarser and do not settle it. Its 2025 annual report shows paid clicks up 6% and cost per click up 7% for Search and other properties, a figure that includes Maps, Gmail and Play and says nothing about click-through rate, because Alphabet does not publish ad impressions.
What could explain it
We can date the drop; we cannot name its cause. Several candidates sit on the results page, and account-side changes shared by many advertisers at once, such as broader matching or new bidding strategies, cannot be ruled out either. Google expanded AI Overviews to more than 200 countries and territories and more than 40 languages in May 2025, inside our deepest stretch, but the drop in these accounts had already started in the winter. Ads can now appear above, below and inside AI Overviews, and Google’s own help page on ads in AI Overviews says they “are reported as Top Ads” with no separate reporting, so an account cannot split them out. Any of these could add impressions that searchers rarely click. Our export holds no ad position at keyword level, and no query-level view of which results page each impression came from, so we report the timing and stop there.
When this does not apply
Your keywords are new. The measurement needs keywords that ran in both years. An account rebuilt in 2025 has no basket to compare, and its account-level CTR will move with the mix.
You read CTR at account level. Your blended CTR can rise while every keyword falls, if spend moves to higher-CTR terms, brand terms most of all. The benchmark reports above are averages of that kind.
Your traffic sits outside these markets. This is an agency-managed portfolio, not a random sample of advertisers, and it leans towards Europe and Ukraine. AI Overviews and ads in them rolled out at different times in different countries and languages.
Your change is only a few percent. One account’s same-keyword CTR moves from year to year even in a quiet year: from 2023 to 2024, before the drop, the middle half of accounts already ranged from 1.01 to 1.16. Compare more than one pair of years before you read a change of a few percent.
How to check yours in five minutes
- In Google Ads, open the keywords view for Search campaigns and set the date range to calendar 2024. Download the keywords, ad groups, impressions, clicks and conversions.
- Do the same for 2025. Keep only the keywords that appear in both files in the same ad group, with at least 30 clicks in each year.
- Compute each year’s CTR as total clicks divided by total impressions for that fixed list, then divide 2025 by 2024. This quick ratio is close to our index but not identical: on our keywords it gives a median of 0.78 instead of 0.75, because it lets the impression mix shift between years.
- If the result sits near 0.78, your keywords moved the way these accounts did. That is a reason to check what changed around them, on the results page and in your own settings, and to compare conversions per click on the same list before you rewrite any ad.
Key takeaways
- For the same keywords, the median account’s CTR in 2025 was 0.75 of its 2024 level, lower in all but one account.
- Median ratios were 1.15 for impressions and 0.85 for clicks; clicks fell in about three accounts in four. A year earlier the same-keyword click-through rate rose about 5%.
- The drop starts in the winter of 2024 to 2025, is deepest from April to October 2025, and the first half of 2026 is still well below the first half of 2024.
- It shows up without search partners and on both devices, and the median conversion rate per click stayed near its 2024 level.
- In hard currencies the cost per click of the same keyword barely moved. The cause is not visible in account data.
Researcher’s take
When CTR drops, the reflex is to rewrite the ads. These numbers argue for looking wider first. The click-through rate of the same keywords fell in almost every account, and the campaign data put the drop in the same months across accounts, which points to something many accounts shared rather than to one account’s copy. Before you touch an ad, put your own same-keyword CTR for 2024 and 2025 side by side. If it fell by about a quarter, treat your ads as one suspect among several, not the obvious one. Then plan on the clicks your keywords actually delivered in 2025, not on their 2024 rate, and keep watching the price of the click and the rate at which clicks convert, which held roughly steady in these accounts.
Igor Ivitskiy, Doctor Ads · 19 years · $770M managed spend
Method
Doctor Ads Profit Forensics is the research desk of a Google Ads practice with 19 years and $770M managed spend behind it.
Data statement v.2026.10. Source: keyword-level performance by year (2023, 2024, 2025 and the first half of 2026) and Search campaign performance by month and by device, January 2023 to June 2026 (July 2026 is cut short by the snapshot and left out), from a managed Google Ads portfolio analysed by Doctor Ads Profit Forensics, read from an API snapshot dated 10 July 2026. Accounts are pseudonymised; no account, campaign or vertical name is published.
Definitions. A keyword is the keyword ID inside its ad group. A keyword enters a pair of windows with at least 30 clicks and some cost in each window; an account enters with at least ten such keywords. The same-keyword CTR ratio is a fixed-basket index: the sum over keywords of earlier clicks times later CTR, divided by the sum of earlier clicks times earlier CTR. The simpler ratio of total clicks to total impressions on the same basket gives a median of 0.776 for 2025 against 2024, with the same direction in all but one account. Across accounts, the 2025-against-2024 baskets hold 1,647 keywords, which carried a median 62% of each account’s 2024 keyword spend; the 2024-against-2023 baskets hold 1,729 and the first-half-2026-against-2025 baskets 1,786. Impression and click ratios are basket totals. Conversions per click are compared only where the basket held at least 30 conversions in both years. The monthly view compares the same Search campaign in the same calendar month one year apart, with at least 50 clicks in both months; April to October 2025 against 2024 covers 153 campaigns. The partner split uses each campaign’s search partner setting in the July 2026 snapshot. The device split compares the same campaign on the same device, with at least 30 clicks in both months. Hard currency means accounts billed in US dollars, euros, pounds, Swiss francs, Canadian, Singapore or Australian dollars, or dirhams.
Weighting. Every headline figure is the median of the account-level ratios; each median is also recomputed leaving one account out at a time, as a stability check. Clicks and impressions can be pooled across accounts, so the April to October window also carries one pooled CTR ratio, with and without the largest account. Conversions are never pooled across accounts. Medians and quartiles use one engine with linear interpolation.
Limitations. Five. The export holds no ad position at keyword level and no search-query or results-page detail, so the cause of the drop cannot be identified. Google reports ads shown in AI Overviews as top ads without a separate segment, so the change in what an impression is cannot be separated from a change in searcher behaviour. The partner setting is read once, in July 2026, and may have differed in 2024 or 2025. Hryvnia-billed accounts paid more per click each year in their own currency, but our data converts each currency at one fixed rate, so devaluation cannot be separated and those figures are not used as a price trend. And the portfolio is agency managed, not a random sample of advertisers.
Changelog. First published October 2026. Recomputed quarterly against the live claim registry.


