

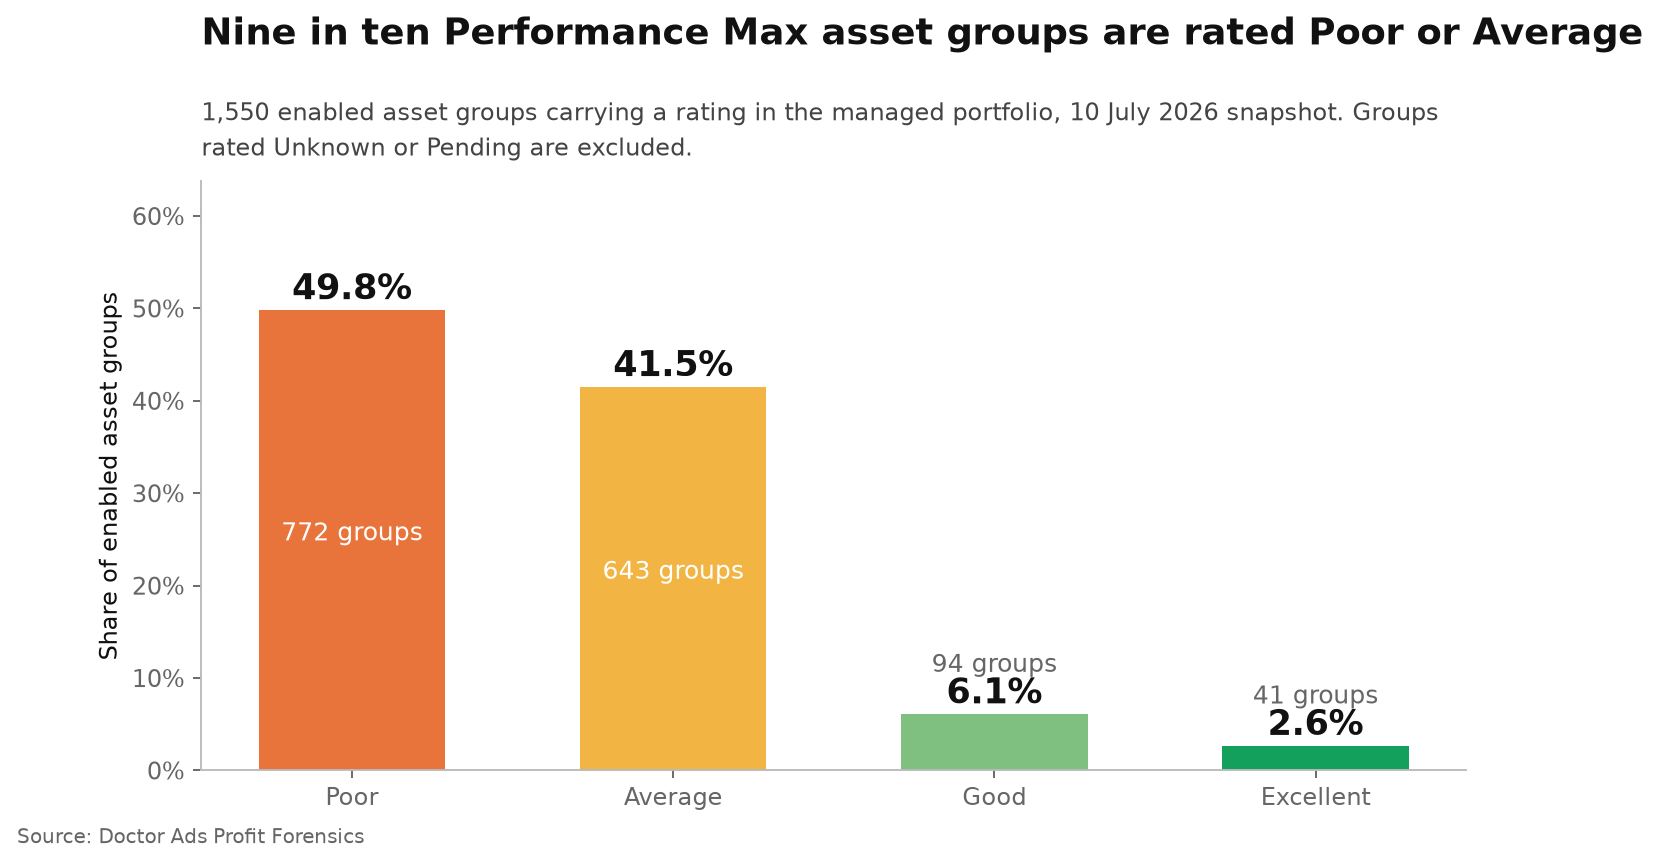
TL;DR abstract. Ad Strength for responsive search ads has been measured by others on very large samples. What we could not find published anywhere is how those ratings are distributed across the asset groups of many real accounts. Doctor Ads Profit Forensics counted it across 1,550 rated asset groups in its managed portfolio: 49.8% rated Poor, 41.5% Average, 6.1% Good and 2.6% Excellent.
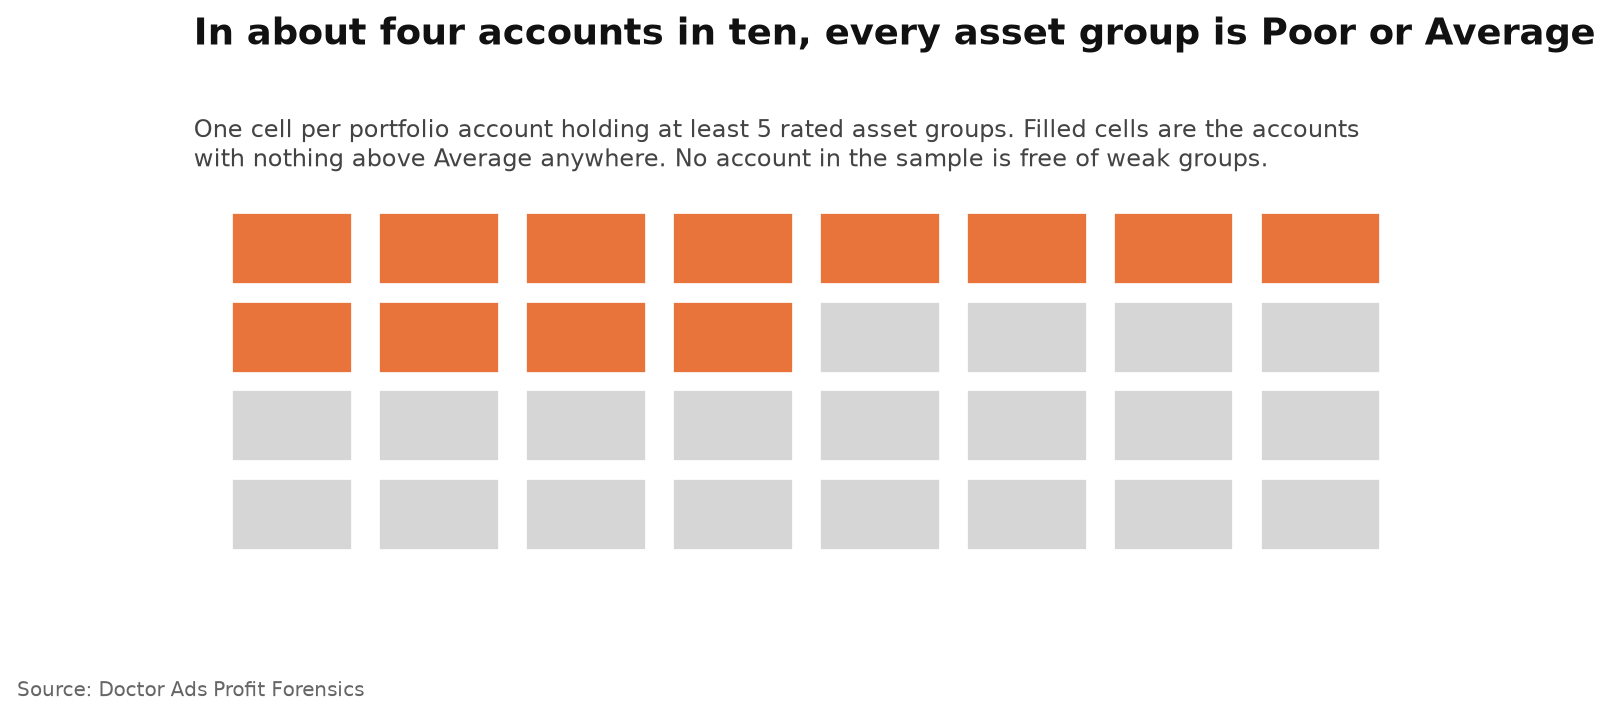
The two weakest ratings together cover 91.3% of rated asset groups, and 89.8% once the account holding the most groups is removed. In the median account, 95.8% of asset groups are Poor or Average; about four accounts in ten have nothing above Average at all, and no account is free of weak groups. Asset groups carry no metrics in this export, so nothing here says what a rating costs.
First, the disambiguation, because the label is shared and the objects are not. Ad Strength on responsive search ads is well mapped: Optmyzr measured it across 22,000 accounts and more than a million ads and found most ads sitting on Poor or Average, and Adalysis measured over a million active responsive search ads and found higher rated ads winning more impressions only 56.8% of the time. That ground is taken.
This page is about a different object. Google gives a Performance Max asset group its own Ad Strength rating, on the same five word ladder, measuring something else: “whether your asset group has breadth and depth to maximize campaign performance”. Google revised how that rating is weighted in February 2024 and has published its own analysis of it. What neither we nor two separate literature searches could find is a multi account distribution of the ratings themselves. That is the gap this page fills, and it fills only the descriptive part of it.
Half of enabled asset groups are rated Poor
Of the 1,550 enabled asset groups carrying an actual rating:
- Poor: 49.8% (772 groups, present in three accounts out of four)
- Average: 41.5% (643 groups, present in six accounts in ten)
- Good: 6.1% (94 groups, present in a quarter of accounts)
- Excellent: 2.6% (41 groups, present in about one account in seven)
Outside that count sit 42 enabled groups rated Unknown and seven more whose rating is still pending. Both are excluded from the shares above rather than folded into a bucket, which is why the four shares sum to 100%.
Taken together, the two weakest ratings hold 91.3% of rated asset groups. Remove the account that contributes the most groups and the figure is 89.8%, so this is not one large advertiser’s housekeeping.
In the median account, 95.8% of groups are weak
Pooled shares hide whether a pattern is everywhere or somewhere. Among accounts holding at least five rated groups, the median share of Poor or Average groups is 95.8%, with the middle half between 77.1% and 100%. Leaving any single account out keeps that median between 95.2% and 96.4%.
About four accounts in ten have no group rated above Average anywhere. Not one account in the sample is free of weak groups. The median share of groups sitting on the lowest rung, Poor, is 37.0%, though that one varies widely between accounts, from 11.1% to 68.0% across the middle half.
Does the rating matter?
Google says two things about it, and they pull in different directions. Its help page describes a Poor group as one that “only serves to some available inventories because it only has the minimum assets required to launch Performance Max”. The limitation there is attributed to missing assets, with the rating acting as Google’s diagnostic of that gap rather than as a penalty applied to the group. Google also cites its own internal data that advertisers who improve their Performance Max Ad Strength to Excellent “notice, on average, 6% more conversions”.
We cannot test either statement with this export, and we are not going to imply that we can. Asset groups here carry structure and status, not cost, clicks or conversions, and nothing in these records shows what any group was able to serve. What the count establishes is narrower and still useful: the rating Google attaches to the thinnest asset coverage is the single most common one in live accounts.
When this does not apply
You keep asset groups deliberately narrow. If a group carries only the minimum assets, Google’s own definition puts it on Poor, and that can be an accepted trade for tight control. Our records do not show how many assets each group holds, so we cannot say how often a Poor rating is a choice rather than an oversight.
You are reading the rating as a quality score. It is not one. It measures breadth and variety of assets against what Performance Max can serve, and Google updates the scale itself over time, which moves ratings without anyone touching the account.
You want to know what it costs. This measurement cannot say. No metrics are attached to asset groups in this export, so any link between rating and performance belongs to Google’s numbers or to a test in your own account.
How to check yours in two minutes
- Open a Performance Max campaign, go to Asset groups, and add the Ad Strength column if it is not shown.
- Count how many groups sit on Poor and Average. If it is nearly all of them, you are in the same place as the median account here.
- Open one Poor group and read what Google asks for before changing anything: it is usually missing formats, not bad copy.
Key takeaways
- 49.8% of rated Performance Max asset groups are Poor and 41.5% Average; Excellent is 2.6%.
- The two weakest ratings hold 91.3% pooled and 89.8% without the largest contributor.
- The median account has 95.8% of its groups on those two ratings, and about four in ten accounts have nothing better anywhere.
- Google says a Poor asset group serves to only some inventories; this page measures how common that state is, not what it costs.
Researcher’s take
The part I find worth noticing is not that Poor is common. It is how thin Excellent is among the groups that are actually running: 41 of 1,550, in ten accounts. Whether that says something about the bar, about how much asset production the rating asks for, or simply about which groups get left enabled, this count cannot tell you. Curiously, most of the Excellent groups in the whole snapshot are not running at all: 276 are paused and 286 removed, spread across seven accounts in total. Before spending an afternoon collecting six sitelinks and shooting vertical video to move one group up a rung, I would want to see what happens to delivery in that account, not in an average of everyone.
Igor Ivitskiy, Doctor Ads · 19 years · $770M managed spend
Method
Doctor Ads Profit Forensics is the research desk of a Google Ads practice with 19 years and $770M managed spend behind it.
Data statement v.2026.09. Source: Performance Max asset group records for a managed Google Ads portfolio analysed by Doctor Ads Profit Forensics, snapshot dated 10 July 2026: 2,860 asset groups in 79 accounts across all statuses, of which 1,550 in 69 accounts are enabled and carry an actual rating; 42 enabled groups are rated Unknown and 7 are still Pending, and both are excluded. Per account figures use the 32 accounts with at least five such groups. Accounts are pseudonymised; no campaign, asset or vertical name is published. Medians and quartiles use a single engine, quantile_cont.
Limitations. Four. Asset groups carry no performance metrics in this export, so no statement about cost or conversions is possible, and nothing here shows what any group could serve. The number of assets in a group is not in the export either, so a Poor rating cannot be traced to what is missing. The rating is read at a single date and Google recalibrates the scale over time. And the portfolio is agency managed, not a random sample of advertisers. Counts in this article are of enabled groups; across all statuses the snapshot holds 562 further Excellent groups: 276 paused in four accounts and 286 removed in four accounts, seven distinct accounts in all.
Changelog. First published September 2026. Recomputed quarterly against the live claim registry.
What to read next
- Ad Strength tested inside the same ad group, the responsive search ad version of the same label, measured on pairs.
- How closely Performance Max follows its target CPA, the same campaign type measured on obedience rather than assets.
- What campaigns actually bid on, on the goals behind those asset groups.


