

TL;DR abstract. Does gender change what a Google Ads conversion costs? Doctor Ads Profit Forensics compared women and men inside each of a set of large-spend accounts audited between 2024 and 2026. The median ratio of cost per conversion, women to men, was 0.99, and in about three accounts in four the two were within 10% of each other. Gender that Google could not identify took a median 28.0% of spend. In the smaller set of accounts with a household income report, Unknown income took about half of spend, and a click from the top 10% cost about 1.5 times a click from the lower 50% while a conversion cost almost the same.
Gender is one of the first demographic levers advertisers reach for, often on a hunch about who buys. Google’s help page on demographic targeting offers three rows for Search: female, male and Unknown, and for some countries a household income report in six tiers plus Unknown. These rows are Google’s inference about the person, the same way Google infers whether someone is in your target area or only interested in it, which we measured in our study of location presence and interest. Published evidence on whether the gender rows differ is thin. Nils Rooijmans describes one home-audio client where women converted at 1.4 times the male rate, and notes that for many of his clients gender performance looks similar. Cornell researchers studied how gender targeting skews ad delivery, and at what cost, in one public agency’s campaigns; it is not a comparison of conversion costs across advertisers. We measured the ratio across accounts.
Women and men convert at almost the same cost
Inside each account we divided the cost per conversion of women by that of men, keeping accounts with at least 30 conversions and 100 clicks on each side. The median ratio was 0.99, with the middle half of accounts between 0.97 and 1.02. Leaving out any one account does not move it at the second decimal. Women were slightly cheaper in about six accounts in ten and men in the rest, and the two were within 10% of each other in about three accounts in four. A gap above 20% appeared in fewer than one account in ten.
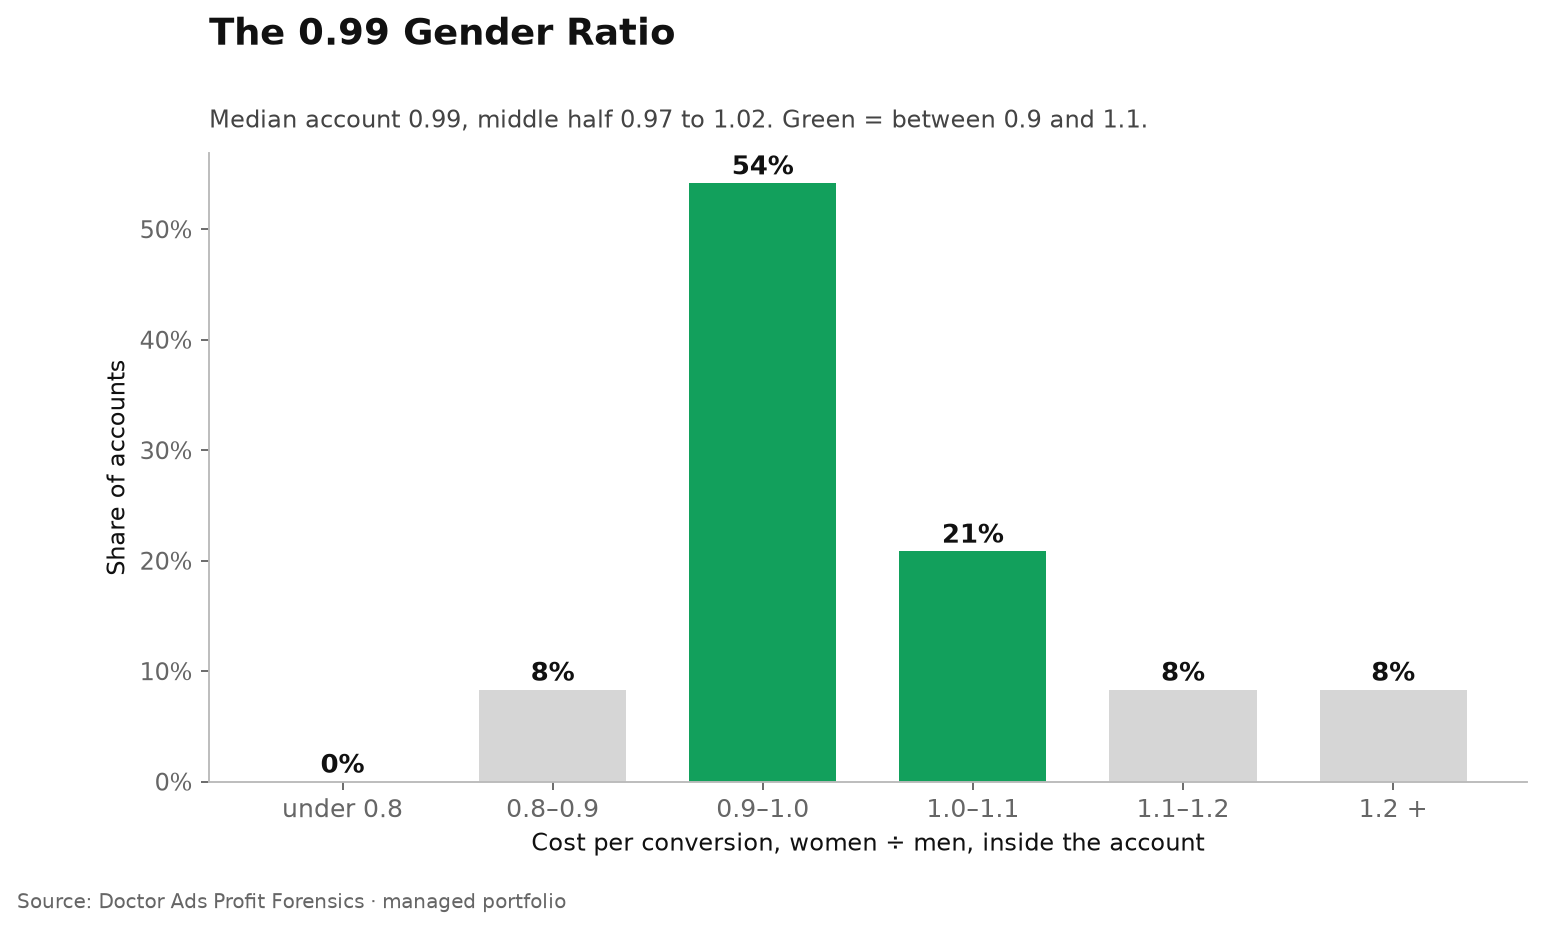
The pieces line up the same way. Women’s clicks cost a median 1.02 times men’s and converted at 1.02 times the rate, and women took a median 51.0% of the spend whose gender was known. Each of these is a median taken on its own across accounts, so they do not multiply out to the 0.99. In the typical account in this sample the two genders are close to interchangeable on cost.
That parity is an average across campaigns. Inside matched campaigns the picture is looser: in the median account, about one campaign in five where both genders had enough conversions showed women and men more than 20% apart in cost per conversion.
More than a quarter of spend has no gender
As with age, a large slice of the money sits in Unknown: a median 28.0% of spend, with the middle half of accounts between 22.2% and 31.4%. Its conversions cost a median 1.09 times the known genders, the same premium we found for Unknown age in our study of the age report.
Income: half Unknown, and a dearer click for the same conversion cost
The household income report exists only where Google offers income targeting, a list of countries that, on the help page we read, includes the US, Canada and Australia and no European country. A smaller set of accounts in the sample carried it, so treat these figures as exploratory. Unknown income took a median 51.6% of spend. A click from the top 10% of household income cost a median 1.49 times a click from the lower 50%, yet a conversion from the top 10% cost almost the same, 1.02 times. In the median account the pricier click did not make the conversion pricier.
When this does not apply
Your buyers are mostly one gender. These accounts sell mostly online subscription services and online education to broad audiences. A business whose customers are mostly women or mostly men may see a real gap.
Your conversions are not the sale. If a lead from one gender closes more often than a lead from the other, the cost per conversion in the report is not the cost per customer. Import the outcome before you act on gender.
You have few conversions. The ratios here need at least 30 conversions on each side. Below that, a few good days can move the ratio a long way.
Your market has no income report. Google offers household income only in a list of countries. Outside it, the income section of this note does not apply.
What to check in your account
- Open Audiences, then Demographics, then Gender, for six to twelve months. Divide the female cost per conversion by the male cost per conversion.
- If the ratio sits between 0.9 and 1.1, the account as a whole has no gender gap; check your largest campaigns the same way before you set gender aside.
- If it sits between 0.8 and 0.9, or between 1.1 and 1.2, check a second period before you move anything.
- If a campaign sits outside 0.8 to 1.2 for two periods in a row with at least 30 conversions on each side, test a bid adjustment under manual bidding. Under Smart Bidding, Google does not support demographic bid adjustments, so test with an experiment rather than an exclusion.
- Where income reporting exists, compare cost per conversion, not cost per click, before you favour the top tier.
Researcher’s take
Gender feels like a lever because it is easy to switch. Across whole accounts it barely moves the cost of a conversion, and the same is true of the top income tier once you look past the click price. A setting that is easy to change is not automatically worth changing. Read the ratio for your own account and your largest campaigns, and if it sits near 1, put your attention on the search terms and the landing page first.
Igor Ivitskiy, Doctor Ads · 19 years · $770M managed spend
Method
Doctor Ads Profit Forensics is the research desk of a Google Ads practice with 19 years and $770M managed spend behind it.
Data statement v.2026.10. Source: the gender and household income reports exported during Doctor Ads audits of large-spend Google Ads accounts, one report per account, the same exports and the same window rule as our age study: the latest dated window, and a whole-history report only where no dated window exists. Export windows run from about two weeks to about five and a half months between August 2024 and February 2026, and a few accounts were exported for their whole history. The gender sample holds about $96 million of spend in those windows; the income sample about $21 million. Most accounts sell online subscription services and online education. Accounts are pseudonymised; no account, campaign or niche name is published beyond that coarse class.
Definitions. Ratios divide women by men, Unknown by the known rows, or the top 10% income tier by the lower 50%, inside one account, and require at least 30 conversions and 100 clicks on each side of the comparison. A few exports carry spend and conversions but no clicks, so click-based ratios use fewer accounts. The campaign view pairs women and men inside the same campaign, with the same thresholds. Unknown shares are the row’s spend divided by the account total, for accounts with at least $1,000 of spend in the report.
Weighting. The figures are medians across accounts; each median is also recomputed leaving one account out at a time, as a stability check. Conversions are never pooled across accounts. Medians and quartiles use one engine with linear interpolation.
Limitations. Four. Export windows differ between accounts. The sample is skewed towards large online subscription and education advertisers, and a business whose buyers are mostly of one gender may see a real gap. The income sample is small and limited to countries where Google offers the report. And these are observed costs, not the result of switching any group on or off.
Changelog. First published October 2026. Recomputed quarterly against the live claim registry.
