

TL;DR abstract. When an ad group runs two ads, how does Google Ads split the impressions over a year, and does the ad it favours have the higher click-through rate? Doctor Ads Profit Forensics looked at Search ad groups in a managed portfolio that served exactly two ads in a year, where both ads and the ad group were still enabled at a later snapshot. In 2025 the more-served ad took a median 70.1% of the group’s impressions, about seven in ten, and the split ran from 68.0% to 72.4% in the other windows. The favourite also had the higher click-through rate in 58.8% of these groups in 2025, and from 64.2% to 69.1% in the other windows: more often than a coin flip, by a margin that is small in 2025 and clearer in 2024. Google’s rotation leans towards one ad without handing it all the impressions.
Google’s default ad rotation is called Optimize. Its help page on ad rotation says that under this setting “ads expected to attract more clicks (and conversions if you’re using a Smart Bidding strategy) are delivered more often into the ad auction”, and that Smart Bidding switches it on automatically. The same page says the alternative “isn’t recommended for most advertisers”. Google also tells advertisers to run at least two responsive search ads per ad group and quotes a 6.6% average gain in conversions from adding a second one.
So what does an advertiser actually see when two ads share a group? The nearest published answer is a 2018 Adalysis post showing a few ad groups of one advertiser where the ad with the worse metrics received about twenty times the impressions of the better one. Optmyzr’s large 2022 study of responsive search ads compares ad types and ad counts, and its April 2026 study of about 20,000 accounts compares performance by creative features and Ad Strength; neither reports how impressions divide inside the group. We counted the yearly split, and how often the favourite also has the better click-through rate.
The favourite takes about seven in ten
We kept Search ad groups that served exactly two ads in the year, with at least 1,000 impressions in the group and at least 200 for the runner-up. Both ads and the ad group also had to be enabled at a July 2026 snapshot, which removes pairs where one ad had been removed or paused by then. It does not prove the two ads ran on the same days. In 2025 the more-served ad took a median 70.1% of the group’s impressions, with the middle half of groups between 57.9% and 78.6%. The other windows give 68.4% in 2023, 72.4% in 2024 and 68.0% in the first half of 2026.
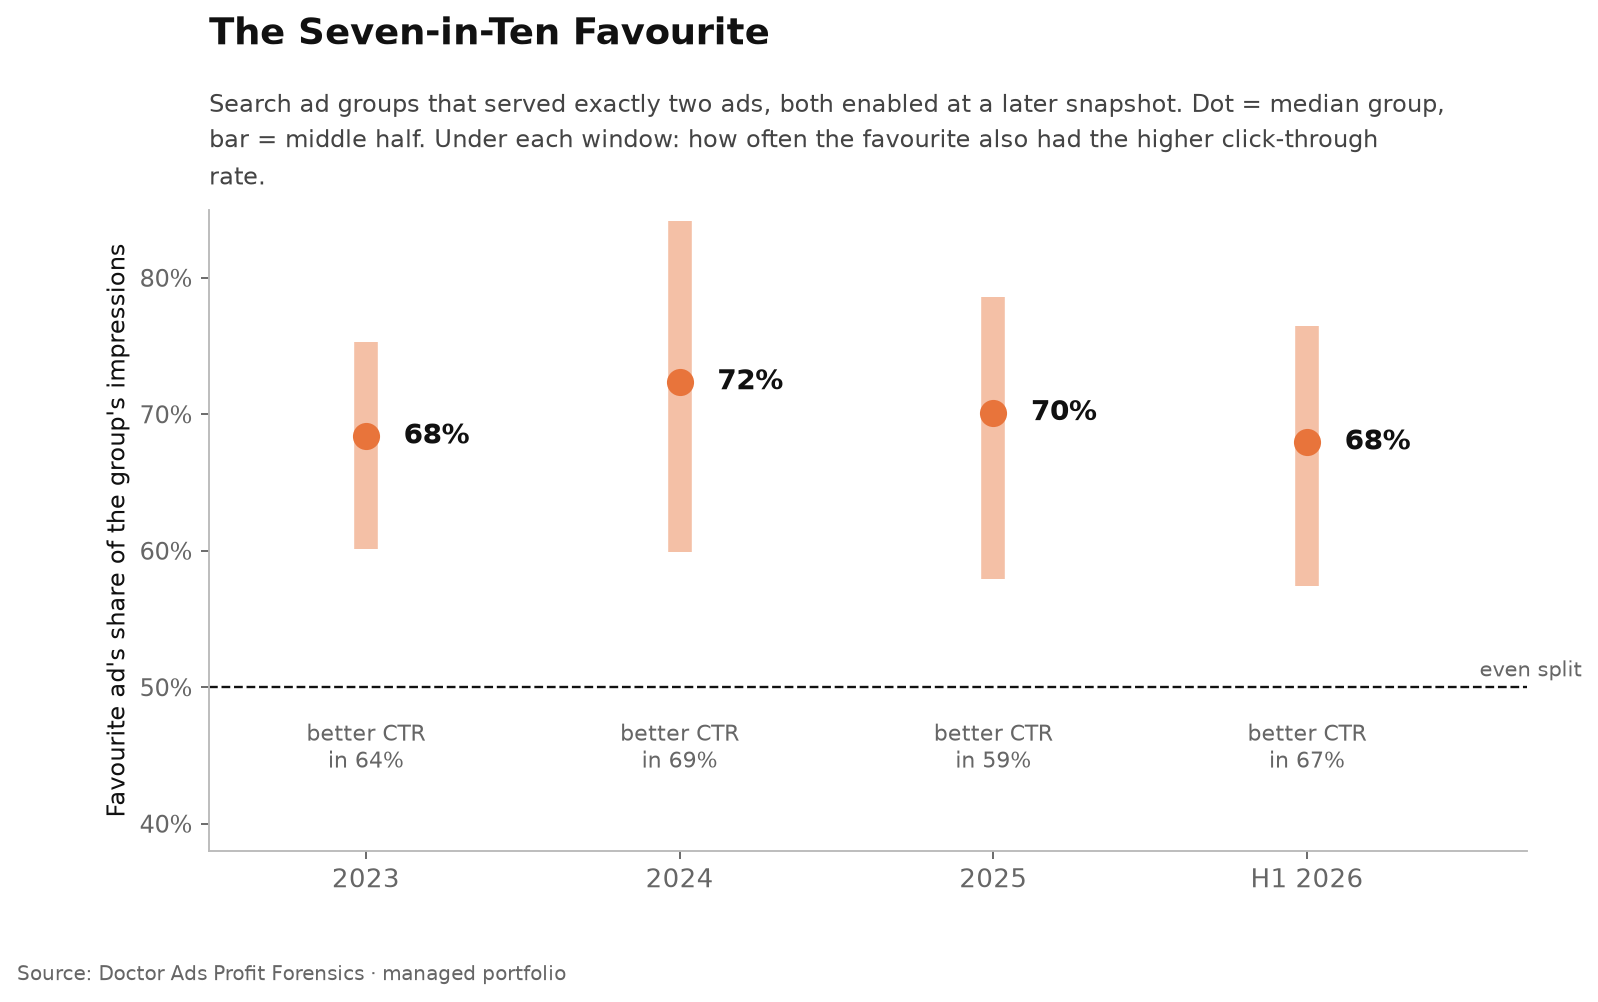
The status filter matters. Without it, keeping the same 200-impression floor for the runner-up, the favourite’s median share in 2025 rises to 74.9%. One possible reason is an ad paused during the year, which shows up in the annual report with a small slice of impressions; the snapshot cannot date pauses. Just over half of the groups that pass the filter sit in campaigns that were paused by the snapshot date; keeping only enabled campaigns gives 67.9% for 2025, close to the headline.
The favourite has the better CTR a bit more often than not
If Optimize sends more impressions to the ad expected to earn more clicks, the favourite should usually have the higher click-through rate. In 2025 it did in 58.8% of these groups, with exact ties left out. On the same rule, the other windows give 64.2% for 2023, 69.1% for 2024 and 67.0% for the first half of 2026. It is better than a coin flip in every window, and never close to certain.
That is not proof that Google picks the wrong ad. Click-through rate depends on where and to whom an ad was shown, and the favourite is shown in more auctions, which may include weaker ones. Under Smart Bidding the system also weighs expected conversions, which a click-through comparison cannot see. What the numbers do say is that the serving share is not a verdict on which ad is better. A seven-in-ten split is how delivery came out, not a test result.
How common two-ad groups are
Our earlier count found that four in five ad groups run a single responsive search ad. Separately, in this portfolio, groups that served two or more ads during 2025 were 22.6% of Search ad groups with impressions. Their share of spend depends on one large account, 55.6% with it and 17.4% without, so we do not read anything into the money side.
When this does not apply
Your ad groups run three or more ads. The split here is for groups with exactly two served ads. With more ads, impressions spread differently and the favourite’s share means something else.
You are running an experiment. An experiment or an ad variation splits traffic on purpose. The figures here describe ordinary delivery, not a designed test.
Your groups are small. We kept groups with at least 1,000 impressions a year and 200 for the smaller ad. Below that, a single week can move the split a long way.
Your ads changed during the year. A yearly report mixes periods when one ad was new, edited or paused. Read the split for dates when both ads were live.
What to do with your own split
- Pick ad groups with two ads that were both live for the whole period, and read each ad’s impressions, clicks and conversions for the same dates.
- A split near seven in ten is normal in these accounts. As a rule of thumb, a split above nine in ten is worth a date check before you read it: an ad that was paused or new for part of the period produces exactly that shape in a yearly report.
- Compare conversion rate, not only click-through rate, before you declare a winner, and, as a rule of thumb, wait for at least a few hundred clicks on the smaller ad.
- For a real test, use an experiment or an ad variation, which splits traffic on purpose. Ad rotation is a delivery setting, not a test.
For a check of how Google’s own Ad Strength label sorts ads inside the same group, see our test of Ad Strength step by step.
Researcher’s take
Advertisers often read the impression split in an ad group as Google’s verdict on which ad wins. In these accounts the favourite takes about seven in ten impressions over a year and has the better click-through rate only somewhat more often than not. That is a delivery outcome, which is fine for running ads and poor for learning from them. If you want to know which message works, set up the test yourself and let it run to a sample big enough to read.
Igor Ivitskiy, Doctor Ads · 19 years · $770M managed spend
Method
Doctor Ads Profit Forensics is the research desk of a Google Ads practice with 19 years and $770M managed spend behind it.
Data statement v.2026.10. Source: ad-level performance by year (2023, 2024, 2025) and for the first half of 2026 in Search campaigns of a managed Google Ads portfolio analysed by Doctor Ads Profit Forensics, read from an API snapshot dated 10 July 2026, joined to the ad, ad group and campaign status of the same snapshot. Accounts are pseudonymised; no account, campaign or vertical name is published.
Definitions. An ad counts as served in a window if it had at least one impression. Ads are identified by ad group and ad ID together, because the same ad ID can sit in more than one ad group. The groups behind the headline figures are ad groups with exactly two served ads, at least 1,000 group impressions and at least 200 for the less-served ad, where both ads and the ad group were enabled in the July 2026 snapshot: 114 groups in 2025, 106 in 2023, 94 in 2024 and 94 in the first half of 2026. In 2025, 51 of the 114 sit in campaigns that were enabled at the snapshot and 63 in paused campaigns. The favourite is the ad with more impressions in the window. CTR comparisons exclude exact ties. The 74.9% figure drops only the status requirement (220 groups); dropping the runner-up floor as well gives 77.0% (249 groups). The share of groups with two or more ads uses all 4,324 Search ad groups with impressions in 2025. The export does not carry the ad type or the rotation setting of the ad group.
Limitations. Four. Enabled status at a later snapshot does not show that the two ads ran on the same days, so the split is a retrospective yearly one. The rotation setting is not visible, although Smart Bidding forces Optimize. Click-through rate depends on the auctions each ad entered, so a higher CTR is not proof of a better ad. And the sample of groups is modest and the portfolio agency managed, not a random sample of advertisers.
Changelog. First published October 2026. Recomputed quarterly against the live claim registry.

