

The short version. Auction Insights looks like a league table of your competitors. We pulled the raw exports from Google Ads accounts across 9 verticals inside the Doctor Ads Profit Forensics portfolio and counted what is actually in them. Of the 159 rivals Google named, 90 arrived with no impression share at all, just the string < 10% where the number should be. That is 56.6% of the report.
- Those unnumbered rivals are not fringe. In the median account they hold 46.3% of the total auction overlap (middle half of accounts: 15.8% to 64.0%). In about half the accounts they hold more than half.
- They are not excluded either. Every one of them is named, and their overlap rate and position above rate are filled in. Across all 159 rows, overlap rate is missing exactly zero times.
- This is a managed portfolio, not a random sample of the market, and the exports cover each account’s own reporting window rather than one shared period. It describes what these accounts saw.
What “< 10%” actually means in your auction insights report
Open Auction Insights and you get a list of domains with six columns beside them if you run Search campaigns, fewer on Shopping. The first is impression share, and it is the column everyone sorts by, because it is the only one that looks like size.
Google’s rule for that column is one sentence long: the report does not show insights when impression share is less than 10%. Read quickly, that sounds like exclusion. The guides that handle the rule carefully read it the other way, as a gate on your own activity: drop under 10% yourself and you lose the report. Neither reading tells you what happens to a competitor sitting below the line, and that is the gap the exports fill. The advertiser is still there, named, with the rest of the row filled in. Only the number is gone, replaced by the literal text < 10%.
The distinction matters because it changes what is missing from your competitive picture. Not the row: the number. Google truncates the list it shows you, so some advertisers never appear at all, but that is a separate limit from the one governing this column.
More than half the rivals in the report arrive without a number
Across the managed portfolio, Google named 159 rivals. 90 of them, 56.6%, came with no impression share.
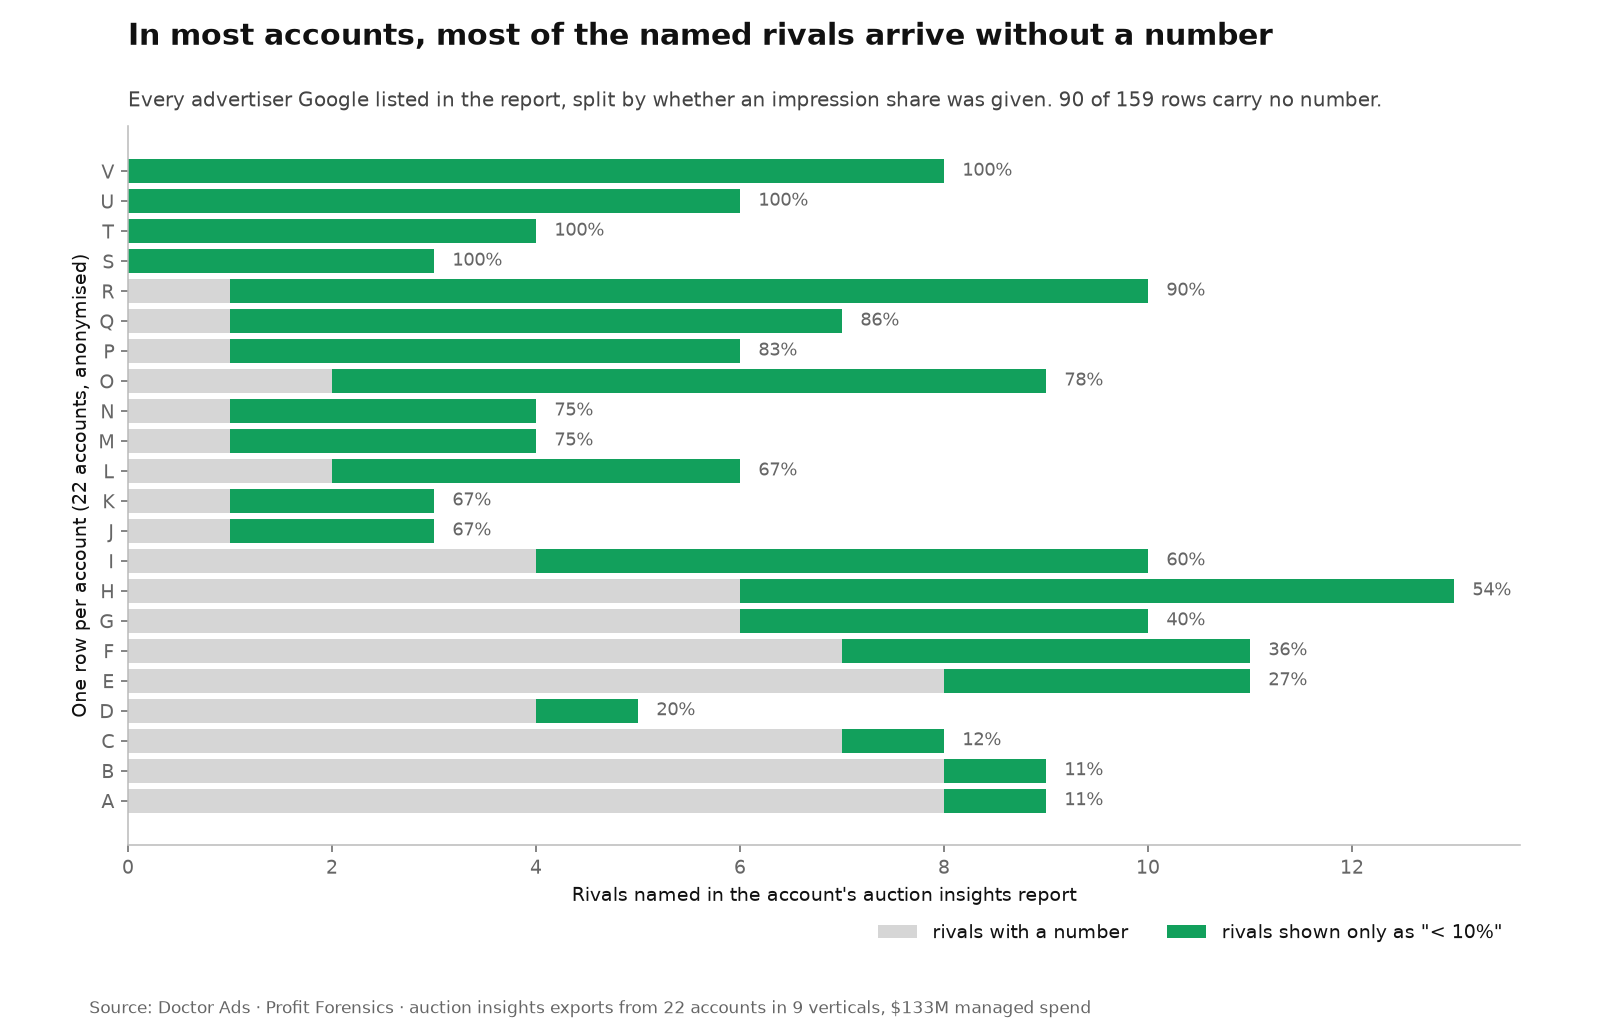
The share is not carried by a handful of odd accounts. Drop any single account from the portfolio and it moves between 54.3% and 59.3%. Drop an entire vertical and it moves between 51.9% and 71.4%, and the direction is worth noting: removing the vertical where our accounts hold the largest share pushes the figure up, not down.
In this portfolio the two moved together: accounts with a stronger presence of their own tended to have more rivals clearing the line. That is an association across the managed portfolio, not a demonstrated mechanism. Still, the practical read holds. A big advertiser sees a report full of numbers and concludes the tool works. A smaller advertiser in the same auction sees mostly thresholds and concludes the competition is thin. Both are looking at the same auction.
Nothing in the corpus sits below ten percent
Here is the check that settles the mechanism rather than describing it. If the threshold excluded advertisers, we would expect to see numeric values scattered near and below the line, with gaps where Google dropped rows. If it substitutes a string, we would expect a hard floor at exactly ten and nothing beneath it.
There are 69 numeric competitor impression shares in this corpus. The lowest is 10.72%. Not one value falls below 10%.
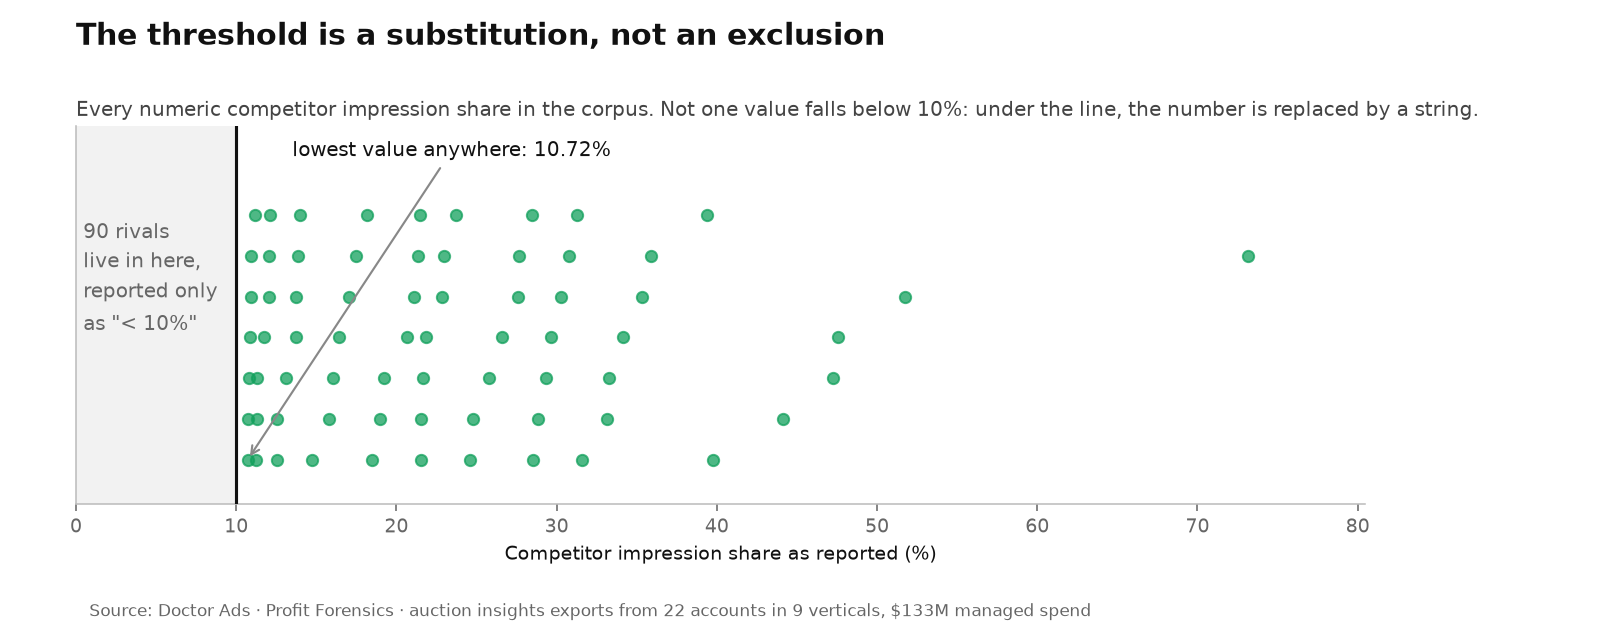
A hard floor with 90 rows stacked invisibly beneath it. What that establishes is narrow, and worth stating precisely: the impression share column is censored at 10%, and the row survives the censoring. It does not establish that every advertiser in your auctions appears in the report, and it decodes nothing beyond that one column. Adthena reads the help-centre sentence as a gate on your own activity, and nothing here contradicts that.
One honest caveat on direction. < 10% is an upper bound, not a zero. Some of those 90 rivals sit just under the line and some far below it, and nothing in the export tells you which. That uncertainty is the whole problem, and it is why the next number matters.
The unnumbered half holds nearly half the overlap
If sub-threshold rivals were genuinely marginal, you could ignore the column and lose nothing. They are not.
Overlap rate answers a different question from impression share: how often did this advertiser appear when you appeared. Sum it across every rival in an account, then ask how much of that total belongs to the rivals with no number. In the median account the answer is 46.3%. The middle half of accounts runs from 15.8% to 64.0%. In about six in ten accounts the unnumbered rivals hold more than a third of the overlap, and in about half they hold more than half.
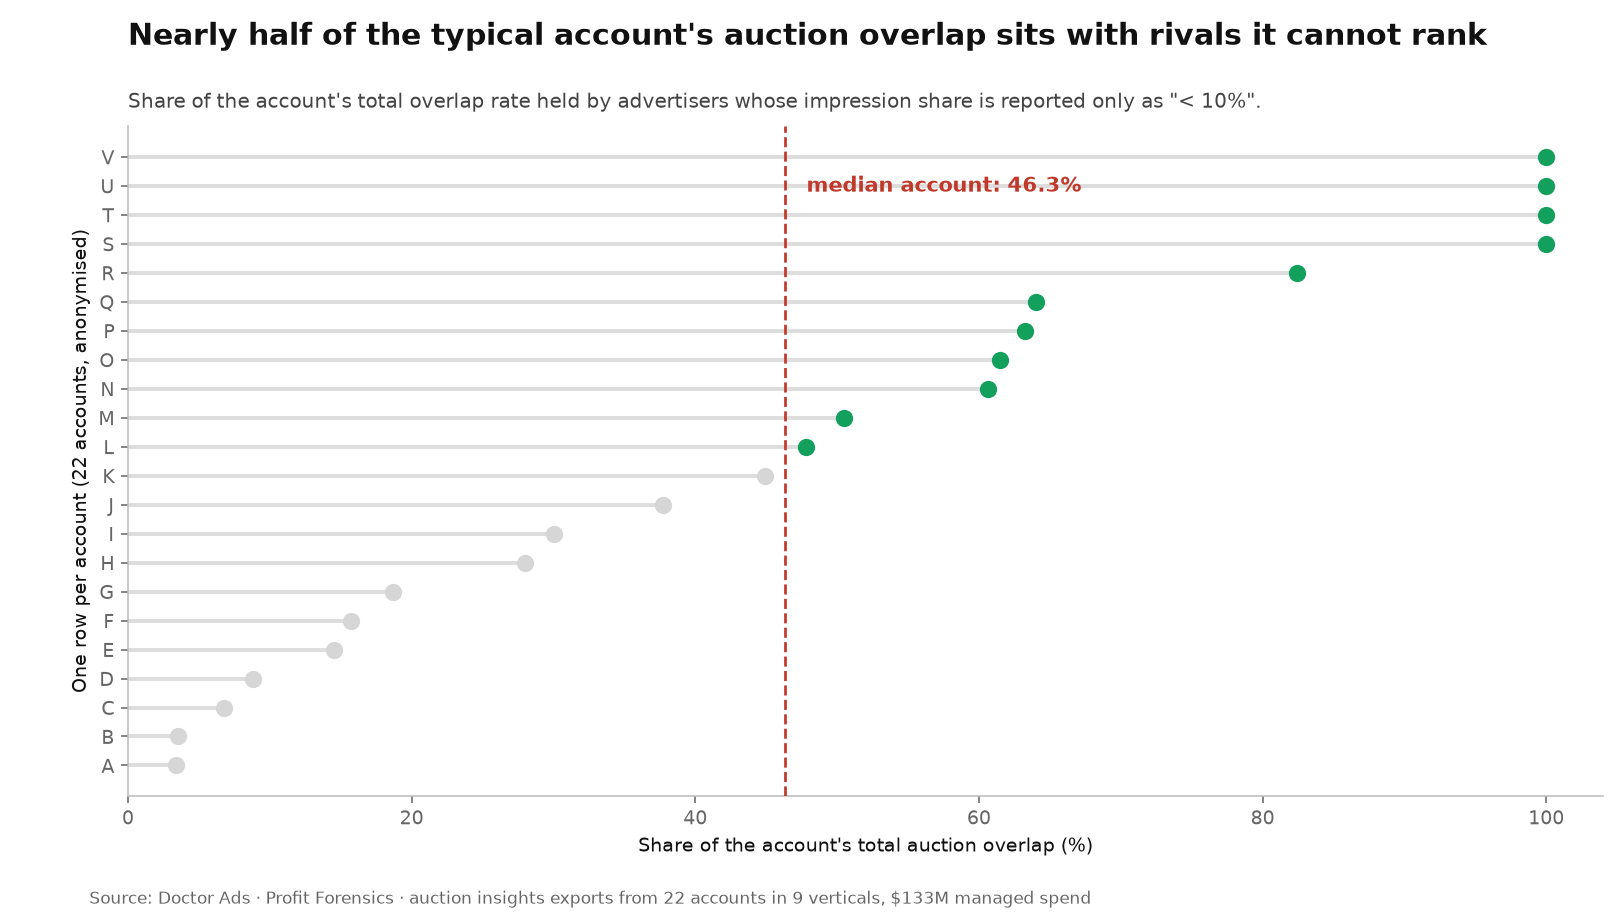
Leave out any single account and that median moves only between 44.9% and 47.8%. This is one of the steadiest numbers in the study.
56.6% of the rows, 46.3% of the overlap, and not one number. Every competitive summary built by sorting the impression share column is built on the other half of the report.
In about one in five accounts, nobody has a number
In about one in five accounts, every single rival Google named came in below the threshold. Three to eight competitors listed per account, and not one impression share among them.
These are not small accounts. In each of these accounts, our own impression share was between 12.1% and 31.1%, comfortably above the line. The report worked, we were visible in it, and it still returned a competitor list with no comparable numbers in it at all.
If that is your account, the intuitive conclusion is that you are dominant and the field is fragmented. The available data cannot support that conclusion. Four rivals just under the line can add up to more contact than one rival at 30%, and the report renders both cases identically.
The frame I had to throw away
The version of this study I expected to write was more fun. It went: the rival with the biggest impression share is not the rival who most often sits above you, so you have been watching the wrong competitor all along. It was pre-registered as the main question, with a kill condition attached.
It died. Among the rivals that do carry a number, impression share predicts position above rate perfectly respectably: the median within-account rank correlation is +0.52 across the accounts with enough numbered rivals to compute one. Only about one in five of those accounts came in near zero. On these accounts the visible part of the league table tracked position above rate directionally.
So the blind spot is not misranking. It is omission, which is a duller headline than the one I set out to write. The sample here also sits below the minimum size this portfolio uses for cross-account claims, so treat that correlation as exploratory rather than a benchmark. It is published because it failed, not because it is strong.
Rank by overlap rate, not by impression share
The fix is not a tool, it is a column. Impression share is missing in 56.6% of rows. Overlap rate and position above rate are missing in zero rows out of 159. Sorting by a column that is populated beats sorting by one that is not, and it takes one click.
None of that is a novel prescription, and it would be dishonest to sell it as one: the better 2026 guides already tell you to work from overlap rate, and Karooya puts it in their action list. What the portfolio adds is the size of what you lose by not doing it. Ranking that way also shows how short the real contest is: in the median account the top three rivals by overlap hold 61.4% of all the overlap in the report, which is an upper bound because Google truncates the list. It is the same shape we found in the concentration of wasted spend and in how much Google Ads budget is wasted: concentration at the top and a long thin floor underneath.
- Sort by overlap rate first. It answers “who do I actually meet”, which is the question you had. Impression share answers “how big are they in this slice”, which is the question you assumed you had.
- Read position above rate as the rank signal. Taking each account’s own median and then the median across accounts, the typical rival sat above us 53.7% of the time both ads appeared. A rival with no impression share at all can still be the one sitting above you in most of the auctions you share.
- Stop treating “< 10%” as “small”. It is an upper bound. Four rivals at that bound can outweigh one at 30%.
- Segment before you conclude. Run the report by campaign, by device and by a narrower date window. Splitting the same traffic moves individual advertisers across the ten percent line, which is the only free way to convert some of those strings back into numbers.
| What you see | The usual reflex | The forensic read |
|---|---|---|
| A rival showing “< 10%” | Small player, ignore | Unknown between 0 and 10; check their overlap and position above rate before deciding |
| Most of the list has no number | The competition is fragmented | Your own share is modest enough that few rivals clear the line; the field may be denser than it looks |
| One rival with a large impression share | That is the competitor to beat | Usually right on order, but check who sits above you most, and check the unnumbered rows first |
| A long list of rivals (we saw 3 to 13 per account) | A crowded auction | Three of them typically hold 61.4% of the overlap; the rest is tail |
Your own account gives you the raw version of this for free. What it will not give you is the denominator: how much of your report is threshold rather than number, how that compares with other accounts, and whether the rivals you cannot rank are gaining. Running that pass across campaigns, windows and both weightings, then placing your account against a portfolio, is what a Profit Forensics examination does.
Update, September 2026: where the lost auctions show up
A later study of the same portfolio adds context. In June 2026, Search campaigns that spent less than half of their daily budget lost a median 38.5% of their eligible impression share to rank and almost none to budget: the auctions they missed went to other advertisers, and the auction insights report, as this article shows, puts no impression share on more than half of the rivals it names. See how much of the daily budget campaigns actually spend and where lost impression share goes.
When this does not apply
Four conditions make these numbers the wrong lens for your account.
You are the dominant advertiser in your auction. The accounts here with the fewest unnumbered rivals were the ones with the strongest presence of their own. If that is you, expect more of your report to carry numbers, and expect this study to overstate your blind spot. We cannot hand you a cutoff: this sample does not support one.
You run mostly Performance Max or Display. Per Google’s own documentation the report covers Search, Shopping and Performance Max campaigns and is unavailable for Display, and position above rate is a Search-only metric. If your spend sits outside Search, the column this study leans on hardest is absent.
You are comparing with a 2026 export. In April 2025 Google updated its Unfair Advantage Policy so one advertiser can appear more than once on the same results page, and impression share moved as a result, without anyone changing a bid. Every export here predates that change. It shifts the levels the report shows, not the censoring rule this study measures, but a like-for-like comparison with fresh data has to account for it.
You need market share, not auction share. Overlap rate counts auctions where both ads appeared. It says nothing about advertisers bidding on queries you never enter, and nothing about spend. Treat it as a map of contact, not of size.
Researcher’s take
I wanted a different article. The one where I show you that the competitor you fear is not the one beating you, because that is the kind of finding that travels. I registered it as the main question, ran it, and it was wrong: on the rivals you can see, the ranking is broadly fine. What was left is the part I nearly walked past. Half the list has no number, and an empty cell reads as small. Empty is not small. Empty is unmeasured. In every audit I inherit, somebody has already named the enemy from that column.
Key takeaways
- Across the managed portfolio and 9 verticals, 56.6% of the rivals named in Auction Insights carry no impression share, only the string “< 10%” (90 of 159 rows).
- They are named, not excluded: the lowest numeric competitor share anywhere in the corpus is 10.72%, and there is nothing below 10%.
- Those rivals hold a median 46.3% of the account’s total auction overlap, and more than half of it in about half the accounts.
- Overlap rate and position above rate are populated in 159 rows out of 159. Rank on those, not on impression share.
- The pre-registered hypothesis of this study died: among the rivals that do carry a number, impression share tracks how often they outrank you, so “you are watching the wrong competitor” is not supported here. The blind spot is omission, not misranking.
Frequently asked questions
What does “< 10%” mean in the Google Ads Auction Insights report?
It means the advertiser’s impression share in that slice was below 10%, and Google replaced the number with a threshold string rather than dropping the row. The competitor is still named, and their overlap rate and position above rate are still reported. In this managed corpus, 56.6% of all named rivals appeared this way.
Do competitors below 10% impression share show up in Auction Insights at all?
Yes, and it is worth checking rather than assuming. Across the managed portfolio we found 90 rivals reported with no impression share but with overlap rate and position above rate filled in, with the entire competitor list sub-threshold in about one in five accounts. What the threshold removes is the value, not the row.
Which Auction Insights column should I sort by?
Overlap rate, if the question is who you compete with. It was populated in all 159 competitor rows we examined, while impression share was missing in 90 of them. Position above rate is the better rank signal: taking each account’s median and then the median across accounts, the typical rival sat above us 53.7% of the time both ads appeared.
How many competitors actually matter in a Google Ads auction?
Fewer than the list suggests. Ranking each account’s rivals by overlap rate, the top three held a median 61.4% of all overlap in the report. That is an upper bound on concentration, because Google truncates the list it shows, so the real tail is longer than what you see.
Can I force Google to show the impression share of a small competitor?
Not directly, but segmentation sometimes does it. The threshold applies to the slice you are looking at, so running the report for a single campaign, a single device or a shorter window can lift an advertiser above 10% inside that narrower slice. It costs nothing to try, and it is the only route from the string back to a number.
Does Auction Insights cover Performance Max?
Google lists Search, Shopping and Performance Max campaigns as supported, and Display as unsupported. The column this study leans on hardest, position above rate, is Search-only, so a portfolio weighted toward Performance Max will get a thinner version of the report than the accounts measured here.
Method and sources
Doctor Ads Profit Forensics is the research desk of a Google Ads practice with 19 years and $770M managed spend behind it.
The September 2026 update cites a separate study of June 2026 budget use in the same portfolio: 123 Search campaigns spending under half their budget, median impression share lost to budget 0.0% and to rank 38.5%.
Figures come from a forensic analysis of a managed portfolio of Google Ads accounts totalling $133M in spend. The population for this study is every account with an Auction Insights export, deduplicated to one reporting window per account, keeping accounts with at least three competitor rows: 22 accounts, 9 verticals, 159 rows of account by competitor. Most windows span September 2024 to January 2025, and they are each account’s own window rather than one shared calendar period. Suppression is defined as a row where the impression share cell contains Google’s threshold string rather than a value; this was verified against 21 raw exports directly, where 66 of 142 competitor rows carried “< 10%”, and confirmed from the inside by the absence of any numeric value below 10%. Six of the 25 source exports reported percentages on a 0 to 1 scale rather than 0 to 100 and were normalised per account before analysis, a detail that silently corrupts averages if you skip it. Results are stable under leave-one-account-out, where the suppressed share moves between 54.3% and 59.3% and the median overlap share between 44.9% and 47.8%, and under leave-one-vertical-out, where the suppressed share moves between 51.9% and 71.4%. Raising the inclusion bar from three competitors to five lowers the suppressed share to 52.9%, as expected, since longer lists belong to accounts with stronger presence. The rank correlation reported above rests on 9 accounts and is labelled exploratory for that reason. This is a managed-agency portfolio with client self-selection and a size skew, so it describes what these accounts saw rather than what the market must contain, and nothing here is a causal claim about how Google sets thresholds. One policy change sits outside these windows: in April 2025 Google updated its Unfair Advantage Policy to let a single advertiser appear more than once on the same results page, which moves impression share independently of bidding. Every export here predates it, so the levels below are pre-change; the censoring rule this study measures is a display behaviour and is not affected, but a comparison against a fresh export should account for the shift. Definitions follow Google’s own documentation for auction insights, impression share and top and absolute top metrics, and the report sits inside the broader practice of comparing performance over time. Industry framings of the threshold were checked against Adthena, Lunio and Karooya. Related reading from the same portfolio: how far Performance Max runs above its target CPA and what average CPC and CTR actually look like by spend tier.