

The short version. Your account summary says the cost per sale is close to goal. That calm is an average. Underneath it, we took 2,723 campaigns that were given an explicit target cost per sale, across the managed portfolio, and asked each one whether it delivered what it was told to deliver. Performance Max came in above its own target in 71.3% of campaigns. Search did it in 26.3%. Same accounts, same six-month window, same instruction.
- The median Performance Max campaign delivered at 1.30x its target, about 30% more per sale than the number in the box. The median Search campaign delivered at 0.95x. Sample: 178 Performance Max campaigns and 1,563 Search campaigns, and Performance Max was not running in every account.
- Across all campaign types, only 26.8% landed within 10% of target, and 47.4% within 20%.
- This is a managed-agency portfolio, campaign type was not assigned at random, and the comparison is descriptive. It says what these accounts did, not what the platform must do.
Does Performance Max hit its target CPA?
Much less often than Search does, and the gap is not subtle. Target CPA bidding means you name the cost per sale you are willing to pay and the system bids to hit that number on average. Google says plainly that some conversions will cost more and some less. The question nobody answers with data is how much more, and for whom.
Hand that instruction to a Search campaign and it comes in more than a tenth above target in 26.3% of cases. Hand it to Performance Max and it does so in 71.3%.
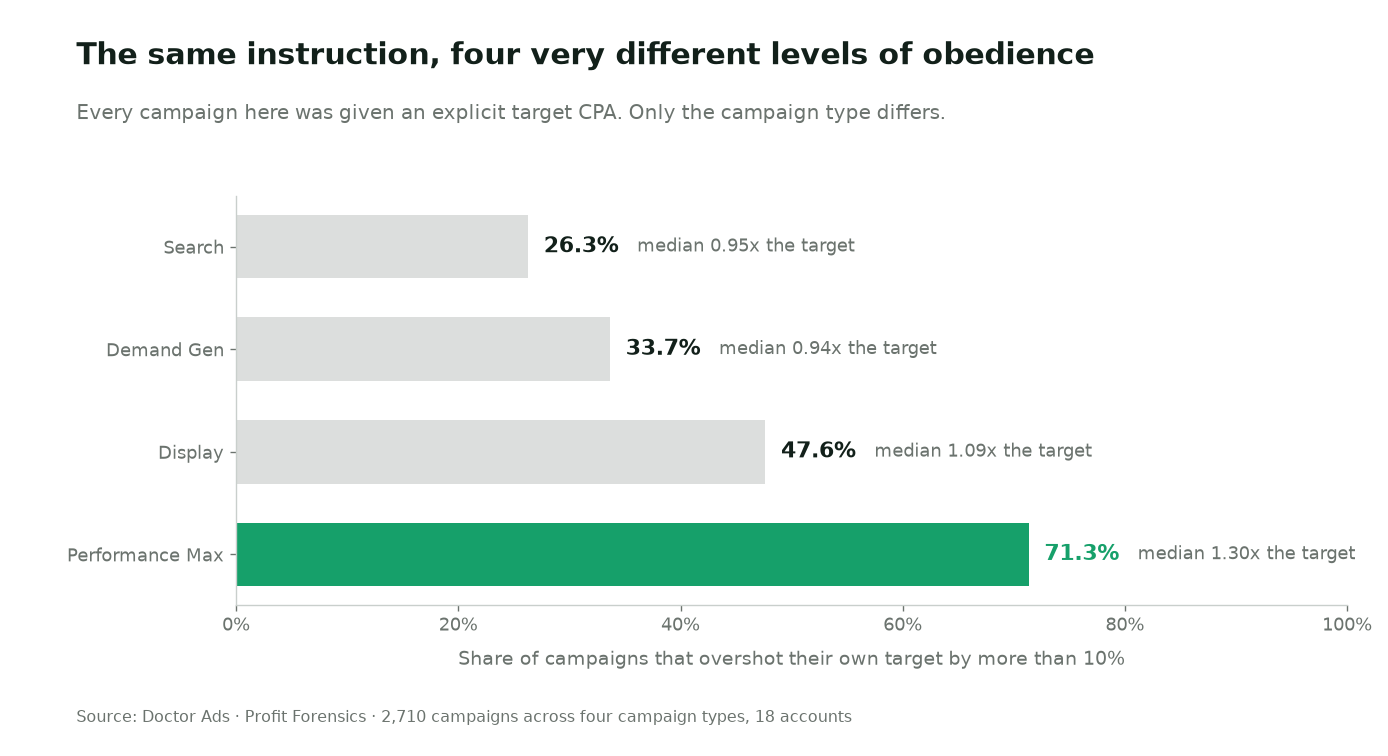
The medians say it from the other side. Half of the Performance Max campaigns delivered at 1.30x their target or worse, against 0.95x for Search. The typical Performance Max campaign here is not missing narrowly. It is running about 30% above the number it was set, and 21.3% of them delivered at twice the target or worse.
Two honest limits before you carry that number anywhere. It rests on 178 Performance Max campaigns, not on the full 2,723, and Performance Max was not present in every account in this portfolio. Nothing here says the campaign type causes the overshoot: advertisers choose where to run Performance Max, and those are often the goals Search already struggles with.
The baseline nobody publishes
Before the comparison, the floor. Across all 2,723 targeted campaigns, only 26.8% delivered a cost per sale within 10% of target.
Notice how generous that band already is. Ten percent either way. A target of $50 counted as a hit anywhere between $45 and $55. Three quarters of campaigns could not stay inside even that. Widen it to 20% and the pass rate still only reaches 47.4%.
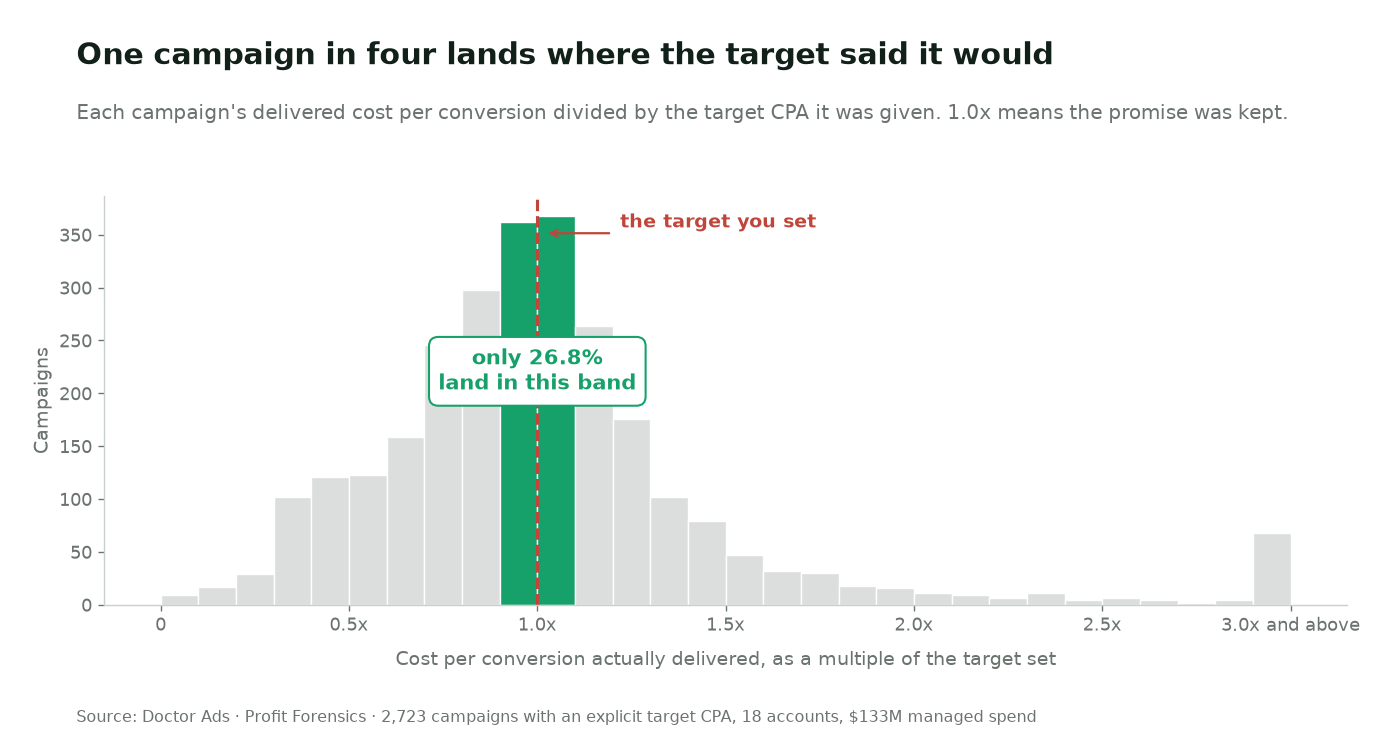
The figure is not an artifact of thin campaigns: raise the bar to 100 conversions per campaign and it moves to 29.1%, and dropping any single account from the portfolio leaves it between 25.0% and 37.8%.
The misses also run both ways. 32.6% of campaigns came in more than 10% above target. 40.5% came in more than 10% below. Cheap sounds like a win, and often it is a sign that the target was never the binding constraint, which means volume you were willing to pay for went unbought. That is a hypothesis you can test with one controlled target raise, not a verdict.
The median that lies
Here is the number that ends most audits early. The median campaign delivered at 0.97x its target. Read alone, that is a system doing its job to within three percent.
Now read the spread. The middle half of campaigns runs from 0.75x to 1.18x. The median is a statement about the pile, not about any campaign in it.
If you have ever opened an account summary, seen the blended cost per sale sitting near goal, and concluded that bidding is under control, this is the gap you were standing on. The account average hits. About a quarter of the campaigns underneath it do. We call that distance the Obedience Gap.
Your big campaigns keep the promise. Your small ones break it
Count campaigns and 26.8% are on target. Weight by dollars and 49.7% of the spend is on target. Half the money sits inside the band that only a quarter of the campaigns reach.
That gap between 26.8% and 49.7% is the most useful line in this study, because it tells you where to look. The misses concentrate in small campaigns. That is consistent with low-volume instability, and also with the plain fact that operators watch big campaigns more closely. This data cannot separate the two.
It also explains why the problem stays invisible. The campaigns that hold their target hold most of the budget, so the account-level number looks healthy while the drift lives in the long tail. It is the same shape we found in how much Google Ads budget is wasted: not one catastrophic line item, a wide floor of small ones.
Obedience is an account trait
If the platform were the whole story, every account would miss in roughly the same proportion. It does not.
Across the portfolio accounts with at least ten targeted campaigns, the share of campaigns landing on target ranges from 10.7% to 72.6%, with a median account at 37.0%. The best account keeps seven campaigns in ten on their number. The weakest keeps one in nine. Same platform, same period, same bidding products.
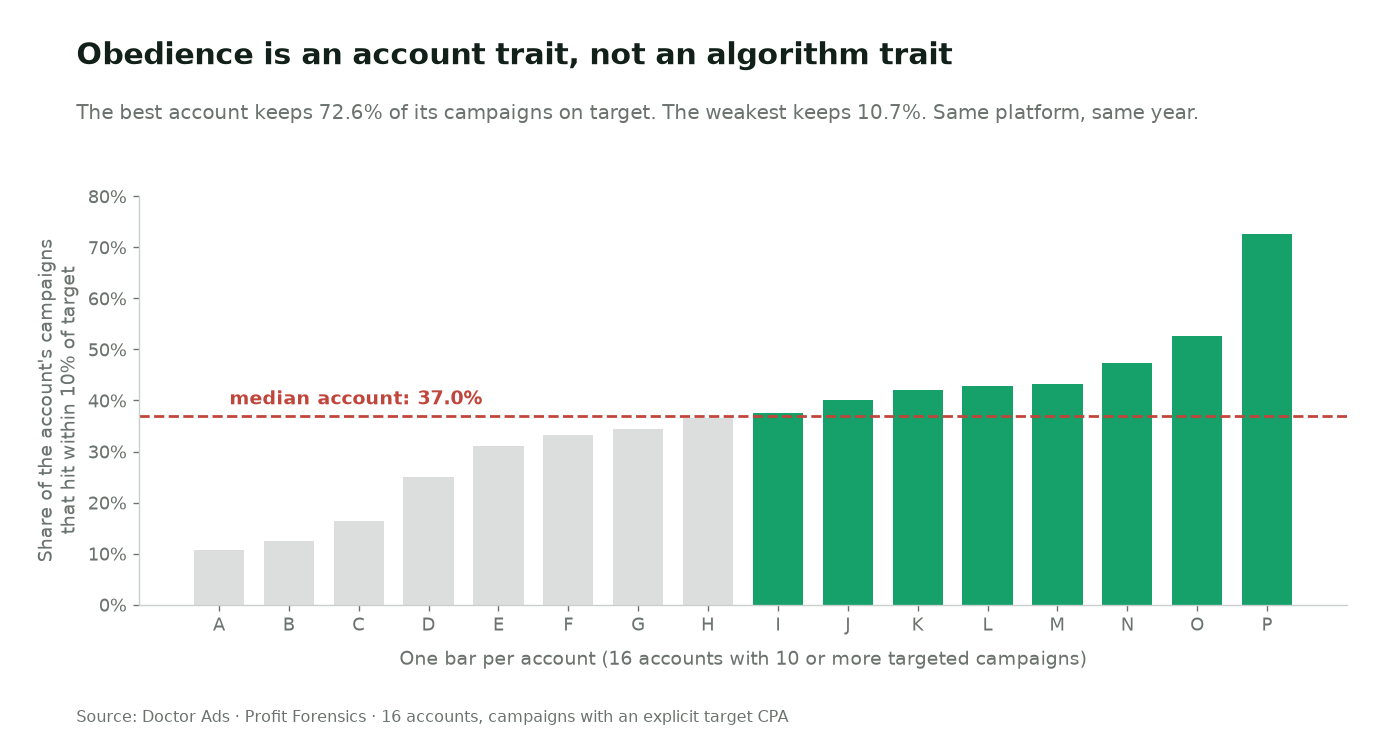
What separates them is not visible in this slice, and I am not going to pretend otherwise. In the accounts I audit the pattern is familiar: the accurate ones set targets near what the campaign has already proven it can do and then leave them alone, while the inaccurate ones set an aspirational number and correct it every time it drifts. That is practitioner observation, not a measurement from this data.
What to do with your own targets this week
None of this argues against automated bidding. It argues for reading a target as an aim with a known error band.
- Measure your own Obedience Gap. For every campaign with a target, divide the cost per conversion it actually delivered by the target you set. Anything between 0.9 and 1.1 is on aim. Count what share of your campaigns qualify, then count it again weighted by spend. Two numbers, ten minutes, and the second one is usually the kinder of the pair.
- Do not reuse your Search target as a Performance Max success bar. In this portfolio the median Performance Max campaign delivered at 1.30x the number in the box. That does not mean tighten the screw: cutting the target as a discipline measure usually starves volume. It means judge Performance Max on profit and total conversions, and if you must use a box number, set it knowing what delivery typically does to it.
- Stop reading undershoot as a win. A campaign at 0.7x target is worth a test, not a celebration. Raise the target deliberately on one campaign and see whether volume follows.
- Leave the target alone long enough to be wrong. Every edit restarts the learning that would have closed the gap. Change it once and give it a full conversion cycle.
| Signal | The usual reflex | The forensic read |
|---|---|---|
| Blended cost per sale near goal | Bidding is under control | Check what share of campaigns are individually on target, by count and by spend |
| Campaign delivering below target | Great, we are efficient | Likely a non-binding target; test one deliberate raise before assuming thrift |
| Performance Max above target | Cut the target or pause it | Roughly seven in ten ran above target here; judge on profit, not on Search-like adherence |
| Target missed for two weeks | Edit the target again | Edits restart learning; change once, then wait a full cycle |
Your own account gives you one honest version of this for free: the bid strategy report shows actual cost per conversion against the average target. What it will not show you is the distribution, which is the whole point of this study. Running that pass across every campaign type, several reporting windows and both weightings, then ranking your account against a portfolio, is what a Profit Forensics examination does.
When this does not apply
Three conditions make these numbers the wrong lens for your account.
- You run almost no campaigns with an explicit target. If your account sits on Maximise Conversions or manual bidding, there is no promise to keep and nothing here to measure.
- Your campaigns are small and few. Under roughly ten conversions per campaign per window, the ratio swings on noise rather than on the bidding system, which is why that was the inclusion floor here.
- Your conversion actions changed inside the window. A new conversion definition, a switch to value-based goals or a tracking fix moves the delivered cost per conversion for reasons that have nothing to do with the target.
Researcher’s take
Owners tell me the target is the one thing in the account they control. It is the one thing they only influence. What I keep seeing is not an algorithm that refuses to obey, it is a portfolio where the obedient campaigns hold the budget and the disobedient ones hold the attention. The number on the summary screen is produced by the first group, so nothing feels wrong until someone opens the distribution. If I could change one habit in the accounts I audit, it would not be the level of the target. It would be how often it gets touched.
Igor Ivitskiy, PhD, Doctor Ads
Key takeaways
- Performance Max came in above its target in 71.3% of campaigns against 26.3% for Search, on 178 and 1,563 campaigns respectively.
- Only 26.8% of all 2,723 targeted campaigns landed within 10% of target; 47.4% within 20%.
- The median campaign delivered at 0.97x target while the middle half spanned 0.75x to 1.18x, so the portfolio average hides the campaign-level reality.
- 49.7% of spend was on target against 26.8% of campaigns: the misses concentrate in small campaigns, which is where nobody looks.
- Target accuracy ranged from 10.7% to 72.6% across accounts on the same platform, so it behaves more like an account discipline than a platform constant.
Frequently asked questions
Why does Performance Max miss its target CPA so often?
This study measures the miss, not its cause, and the honest answer is that the two cannot be separated here. What can be said: among 178 Performance Max campaigns, 71.3% delivered more than 10% above target and the median landed at 1.30x, while 1,563 Search campaigns in the same accounts sat at 26.3% and 0.95x. Advertisers also choose what to put into Performance Max, often the goals Search already found expensive, so part of the gap belongs to the assignment rather than the product.
Do target CPA campaigns actually hit their target?
A quarter of them do, in the strict sense of landing within 10% of the number set. Google describes the target as an average the system aims at rather than a cap, and this data puts a size on that: the median campaign is close, but the middle half of campaigns lands anywhere between 0.75x and 1.18x of what was asked.
Should I lower my target CPA if the campaign is overshooting?
Rarely as a first move, and never as a punishment. A lower target usually buys less volume rather than a lower cost per sale, and every edit restarts the learning period that would have closed the gap. Set a target the campaign has already shown it can approach, then leave it for a full conversion cycle before judging it.
Is it good if my campaign comes in below its target CPA?
Not automatically. 40.5% of campaigns delivered more than 10% below target, and a campaign well under its number is often telling you the target is not the binding constraint. The way to find out is a deliberate target raise on one campaign, watching whether conversion volume follows.
How long should I wait before judging whether a campaign hit its target?
Longer than most accounts allow, and this study cannot tell you the exact number because it measures the end state of a reporting window rather than the path to it. What it does show is that campaigns with more conversion volume land closer to target, so the practical rule is to judge on a full conversion cycle of real volume rather than on a calendar week, and to treat every target edit as the start of a new wait.
If Performance Max overshoots this often, is it worth using at all?
That is a profit question, not an adherence question, and this data deliberately does not answer it. A campaign type that runs 30% above its target can still be the most profitable line in the account if it brings conversions the other campaigns never reached. What the numbers do say is that judging Performance Max by target adherence, the way you would judge a Search campaign, will mislead you in roughly seven cases out of ten.
Method and sources
Doctor Ads Profit Forensics is the research desk of a Google Ads practice with 19 years and $770M managed spend behind it.
Figures come from a forensic analysis of a managed portfolio of Google Ads accounts totalling $133M in spend, measured over each account’s primary reporting window, most spanning September 2024 to February 2025. The population for this study is every campaign carrying an explicit target CPA with at least 10 conversions and non-zero cost, deduplicated to one row per campaign: 2,723 campaigns across 18 accounts and 7 verticals. Accuracy is the campaign’s own delivered cost per conversion divided by its own target, both in the account’s own currency, so the ratio is unitless while cost levels are never pooled across accounts. Multiples are rounded to two decimals throughout. The denominator is the campaign’s configured target as exported, not Google’s traffic-weighted average target, so mid-window target edits and device adjustments can inflate an apparent miss; recomputing on average target is the natural follow-up study. The result is stable under tighter conversion thresholds, moving from 26.8% at 10 conversions to 29.1% at 100, and under leave-one-account-out, where the on-target share ranges from 25.0% to 37.8%. Campaign type was not randomly assigned and this portfolio carries client self-selection, so the comparison is descriptive rather than causal. As a side note with a much smaller sample, 370 campaigns in 8 accounts carried an explicit target return on ad spend: 29.5% landed within 10% of it and the median delivered 0.90x, which is a direction rather than a benchmark. An earlier study on a narrower slice of this portfolio, how often target CPA bidding hits the target, covered 1,950 campaigns and $42M; this run widens both. Related reading: portfolio bid strategies and the dead hours in your account.


