

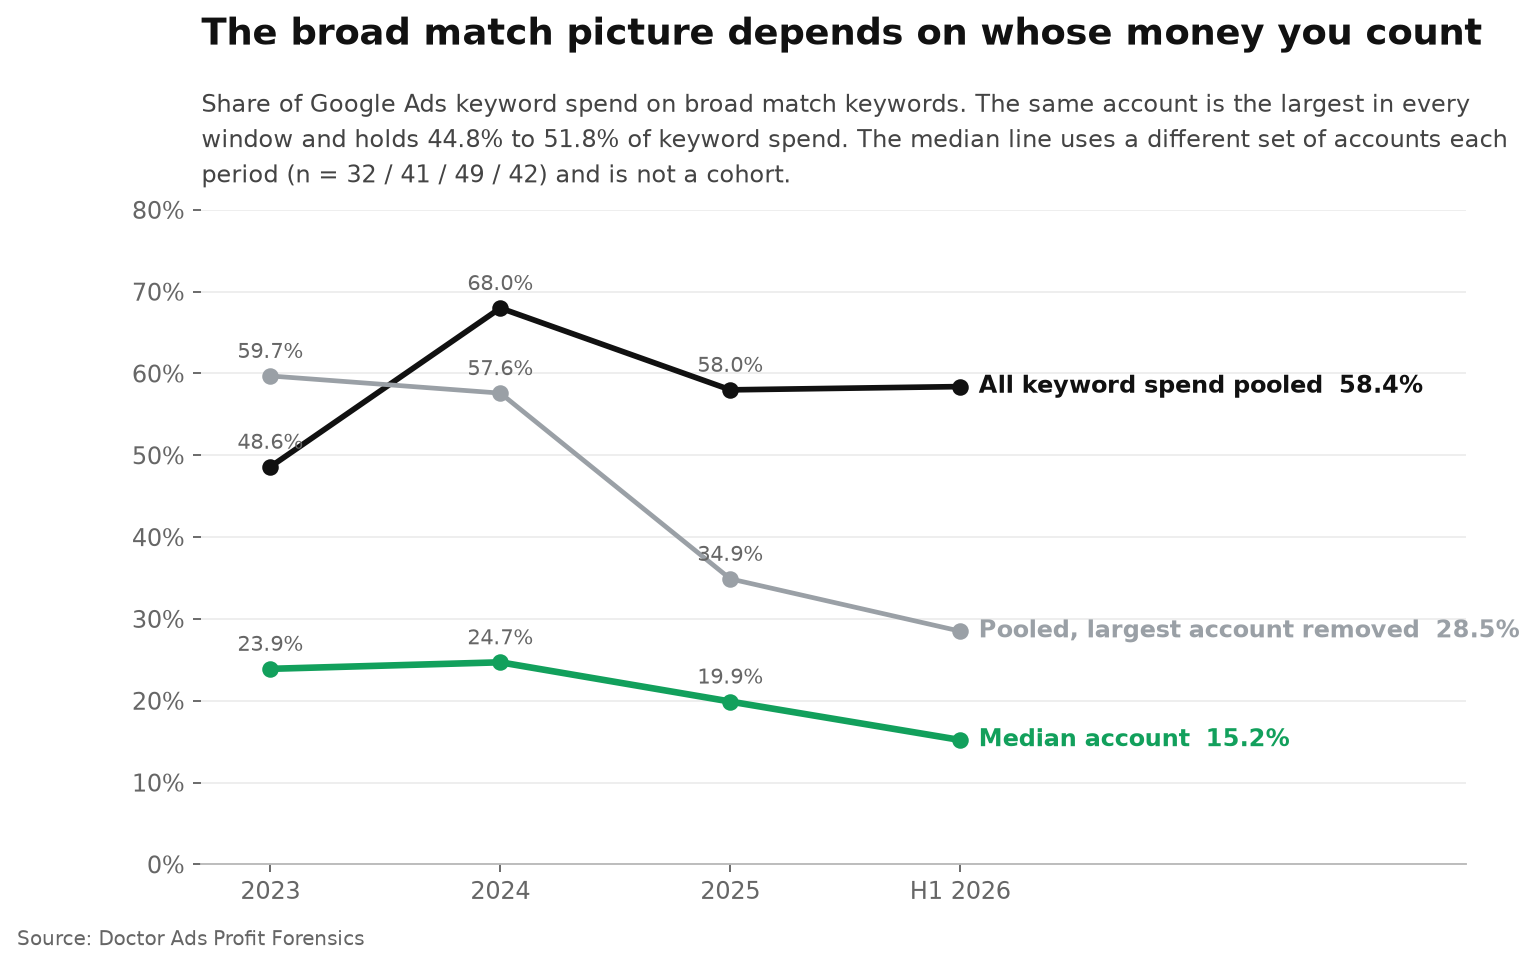
TL;DR abstract. In a May 2026 study of 30,000 Google Ads accounts, using February 2026 data, Optmyzr reported that broad match “has climbed steadily to become the dominant match type by budget”, with exact match losing nearly 10 percentage points of spend share since 2022. A pooled count in a managed portfolio analysed by Doctor Ads Profit Forensics ends in the same place: broad match keywords took 48.6% of keyword spend in 2023 and 58.4% in the first half of 2026, though not in a straight line. The same account is the largest in every period and holds between 44.8% and 51.8% of keyword spend.
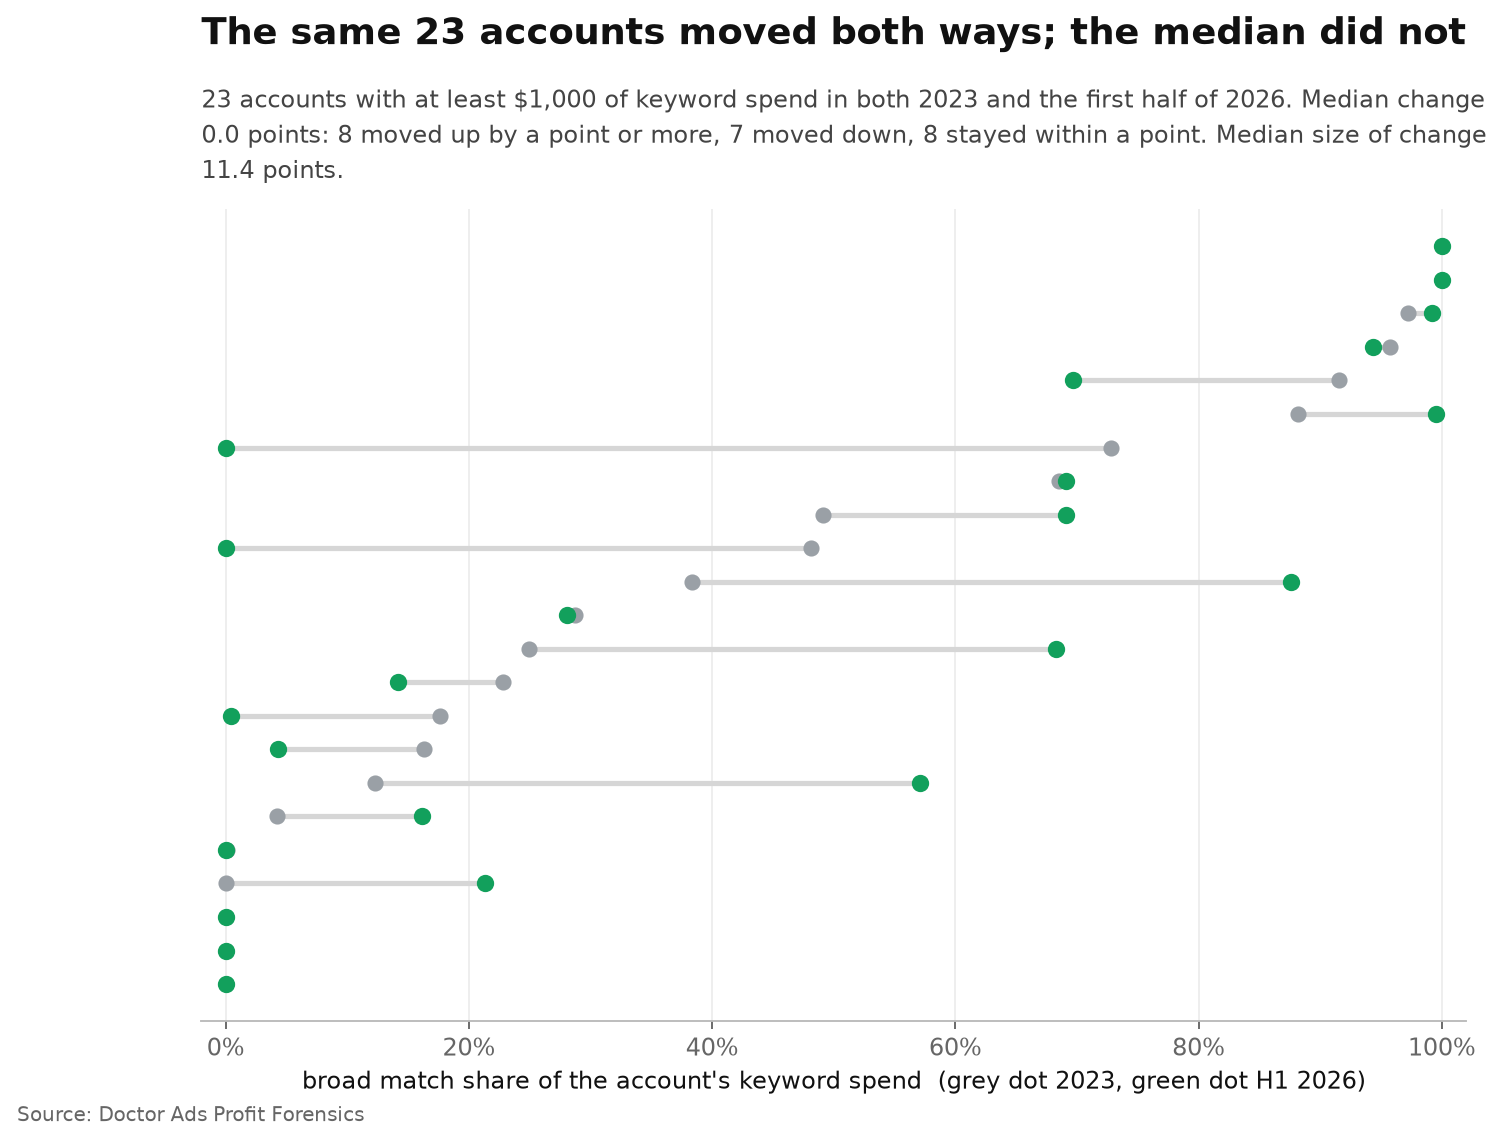
So we also followed accounts. In the 23 continuing accounts that spent at least $1,000 on keywords in both 2023 and the first half of 2026, the median change in broad match share is 0.0 points. That zero is not stillness. The median account moved by 11.4 points in one direction or the other, 13 of the 23 moved by 5 points or more, and the moves ran both ways: 8 up by a point or more, 7 down, 8 within a point. Shares moved in both directions and cancelled out in the median.
Broad match is “the default match type that all your keywords are assigned”, and Google’s recommendation to switch phrase match keywords to broad match under Smart Bidding comes with its own figure: advertisers “can see ~25% more conversions” in Target CPA campaigns, sourced to Google internal data from 2020. The open question has been how far advertisers followed.
The largest recent study we found is Optmyzr’s. In Broad Match is Winning the Budget War, Frederick Vallaeys reports on 30,000 accounts in February 2026: exact match “has lost nearly 10 percentage points of spend share, while broad match has climbed steadily to become the dominant match type by budget”, and phrase match “dipped in 2024 before recovering through 2026.” Adalysis measured something different in 2025: the share of keywords, not of money, by match type under each bid strategy, across 16,825 search campaigns over three months, after excluding large brand advertisers.
A pooled spend share answers where the money went. It cannot, on its own, say how individual accounts changed, because a few heavy spenders can move a pool, and the set of accounts in a pool can change from year to year. Optmyzr’s article does not say whether its account set was fixed across years. We did not find published within-account changes for a documented matched multi-year cohort, so that is what this page adds, on a smaller portfolio.
Pooled, broad match ended at 58.4% of keyword spend
The data is keyword spend in a managed Google Ads portfolio for calendar 2023, 2024 and 2025 and for January to June 2026, attributed to the match type of the keyword that spent it. A keyword’s match type cannot be edited in place, so today’s type is the type the keyword always had; match type was recovered for 97.2% of 2023 keyword spend and for 99.8% to 100.0% afterwards.
Counted as one pool, broad match keywords took 48.6% of keyword spend in 2023, 68.0% in 2024, 58.0% in 2025 and 58.4% in the first half of 2026: a jump, a fall, and an end point above the start. Phrase match went from 29.0% to 13.0% over the same span, and exact match from 22.4% to 28.5%.
One account holds about half the money in every year
The pool is concentrated. The same account is the largest keyword spender in all four periods, holding 51.8% of keyword spend in 2023, 47.9% in 2024, 44.8% in 2025 and 50.7% in the first half of 2026. Take that account out and the pooled broad share reads 59.7%, 57.6%, 34.9% and 28.5%. That is a sensitivity check, not a decomposition: it shows how much one account can steer the pooled line, not why the line moved.
The year-by-year median account needs the same caution. It reads 23.9% in 2023, 24.7% in 2024, 19.9% in 2025 and 15.2% in the first half of 2026, but those are four different sets of accounts, 32, 41, 49 and 42 of them, and a changing set can move a median without any account changing its mind.
The same 23 accounts: a zero median built from moves in both directions
To see what accounts did, we kept the 23 continuing accounts that spent at least $1,000 on keywords in both 2023 and the first half of 2026, and compared each account’s broad match share in the two periods.
The median change is 0.0 points, with the middle half of accounts between −5.0 and +11.6 points, and leaving any one account out does not move it off zero. But the size of the moves tells a different story from their median. The median account moved by 11.4 points in one direction or the other, with the middle half between 0.3 and 21.5 points, and 13 of the 23 moved by at least 5 points. 8 raised their broad share by a point or more, 7 cut it by a point or more, and 8 stayed within a point. The median share was 28.7% at the start and 28.1% at the end.
The other pairings the data allows give the same signed median with smaller moves. From 2024 to the first half of 2026: 0.0 points across 28 accounts, median size of change 4.7 points, 9 up, 10 down and 9 flat. From 2025: 0.0 points across 36 accounts, median size of change 2.7 points, 9 up, 13 down and 14 flat. Comparing two full years, 2023 with 2025, avoids mixing a half year with whole years: 0.0 points across 25 accounts, median size of change 10.0 points, 11 up, 8 down and 6 flat. The half-year comparisons do not control for seasonality, and $1,000 in six months is a higher spending bar than $1,000 in a year.
We are calling this the Offsetting Broad Match Shift. The number to keep is not the 0.0 on its own. It is 0.0 next to 11.4: accounts changed a lot, in opposite directions, while the pooled budget line ended higher.
The accounts sit at both ends
The distribution in the latest period has two heavy ends. In the first half of 2026, among the 42 accounts with at least $1,000 of keyword spend, 11 spent nothing at all on broad match keywords, and 14 put more than half of their keyword spend there. This snapshot cannot say why each account sits where it does. Campaign requirements, the mix of brand and non-brand terms, and the policy of whoever manages the account are all plausible explanations, and none is measured here. Performance by match type is a separate question, measured on an earlier dataset in how much more broad match actually costs.
When this does not apply
Most of your search buying runs outside keywords. This page counts keyword spend only. Performance Max, AI Max for Search and other ways of buying searches without a keyword are outside these figures. An account that moved budget from keywords into Performance Max looks, here, like an account whose keyword mix stayed put.
You want to know whether broad match performs. This page does not measure that, and it does not test Google’s 25% figure, which is Google’s own claim on Google’s own data. It does not say the large pooled studies are wrong: Optmyzr’s pool and this portfolio’s pool point the same way.
Your account is the whale. If you are the large spender in your own benchmark group, the pooled figure is effectively your figure, and the median account is not your comparison.
You changed strategy recently. Comparing periods a year or more apart smooths over a switch made a few months ago. Compare your own last two quarters instead.
How to check yours in about five minutes
- In the Keywords view, segment or filter by match type and set the date range to a full recent quarter. Note broad match cost as a share of total keyword cost.
- Repeat for the same quarter a year earlier. The difference is your own version of the paired number, and its size matters as much as its sign.
- If your benchmark is a pooled industry figure, ask who holds the money in that pool before reading your gap against it.
- Decide on your own results, not on which match type is winning the budget count.
Key takeaways
- Pooled, broad match keywords took 48.6% of keyword spend in 2023 and 58.4% in the first half of 2026, via 68.0% in 2024 and 58.0% in 2025.
- One account holds 44.8% to 51.8% of that spend in every period; without it, the pooled broad share goes from 59.7% to 28.5%.
- In 23 continuing accounts, the median change in broad match share is 0.0 points, but the median size of change is 11.4 points and 13 of 23 moved by at least 5 points.
- The full-year comparison, 2023 with 2025, gives the same signed median: 0.0 points across 25 accounts.
- In the first half of 2026, 11 of 42 accounts spent nothing on broad match keywords and 14 of 42 put more than half of keyword spend there.
Researcher’s take
Every year I see a pooled budget chart used as proof that “everyone” has moved to broad match. This portfolio shows why that reading is fragile: the pooled line ended higher, one account held half the money, and the continuing accounts moved sharply in both directions. My hypothesis, not a finding, is that match type is often decided once per account, by whoever manages it, which would explain the heavy ends. If you are choosing, choose on your own conversion data over a full quarter, and ignore which side is winning the pooled count.
Igor Ivitskiy, Doctor Ads
Method
Data statement v.2026.09. Source: keyword settings and keyword performance for a managed Google Ads portfolio analysed by Doctor Ads Profit Forensics, settings snapshot dated 10 July 2026, performance for calendar 2023, 2024 and 2025 and for January to June 2026. Earlier periods hold a single account and are excluded. Costs are normalised to USD. Accounts are pseudonymised, and no keyword text, ad group, campaign or vertical name is published.
Definitions. Keyword spend is attributed to the match type of the positive keyword that recorded it; match type was recovered for 97.2% of 2023 keyword spend and 99.8% to 100.0% in later periods. Keyword spend totals are $3.22M, $3.22M, $3.92M and $1.90M for the four periods. Pooled shares use every account with keyword spend in the period: 49, 61, 73 and 64 accounts. The median account uses accounts with at least $1,000 of keyword spend in the period: 32, 41, 49 and 42 accounts. Paired comparisons use accounts meeting that bar in both periods of a pair; a signed change of less than one point counts as flat, and the size of change is the absolute value of the signed change.
Weighting. Pooled shares are reported with and without the largest account; without the three largest accounts the pooled broad share is 32.7%, 39.0%, 30.1% and 37.4%. Account medians are reported with the middle half and with leave-one-account-out checks. Medians and quartiles use linear interpolation.
Counter hypothesis. The proposed alternative was that the falling year-by-year median, from 23.9% to 15.2%, shows accounts moving away from broad match. On accounts present in both periods of four different pairings, the median signed change is 0.0 points in all four, so the fall is not supported as a within-account trend.
Selection note. Agency-managed portfolio, not a random sample of advertisers. Match type choices here are made by account managers, and the paired groups consist of accounts that stayed in the portfolio for several years.
Limitations. Four. Keyword spend only, with Performance Max and keywordless buying excluded. Paired groups are small, 23 to 36 accounts. Half-year periods are compared with full years without a seasonal adjustment. And the pooled figures are dominated by one account.
Changelog. First published September 2026. Recomputed quarterly against the live claim registry.
What to read next
- Quality Score and CPC inside the account, on what the displayed score lined up with in the same portfolio.
- How much more broad match actually costs, the performance side of the same setting.
- Half your wasted spend sits in 10% of your search terms, on where search spend concentrates.
- The pooled view at scale: Optmyzr’s 30,000-account match type study.

