

The short version. Everyone knows exact match usually wins on cost. The largest public study on this, Optmyzr’s 2,637-account analysis, found exact ahead on cost per action in 70.79% of accounts. We measured the same comparison inside the accounts of our own managed portfolio and landed in the same direction: broad was more expensive in two thirds of accounts. The part nobody publishes is the size of the gap.
- At the median account, broad cost 6.4% more per recorded conversion than exact. Not a multiple. Six percent.
- Half of these accounts sat between 0.96x and 1.20x of parity, which is inside the month-to-month noise of an ordinary account.
- The accounts themselves differ far more than the match types do: from 0.58x to 8.63x. Which account you are looking at moves the number more than which match type it uses.
How much more does broad match actually cost?
At the median account in this portfolio, 6.4% more per recorded conversion than exact. That is the whole measured gap.
The unit here matters, so read it carefully: we aggregated cost and conversions by the configured match type of the keyword, not by how narrow the search term itself was. Google’s matching rules mean a broad keyword can also pick up the searches an exact keyword would have caught, and account structure decides which keyword wins that routing. So this is a comparison of two settings as they actually ran in live accounts, not a controlled test of incremental reach.
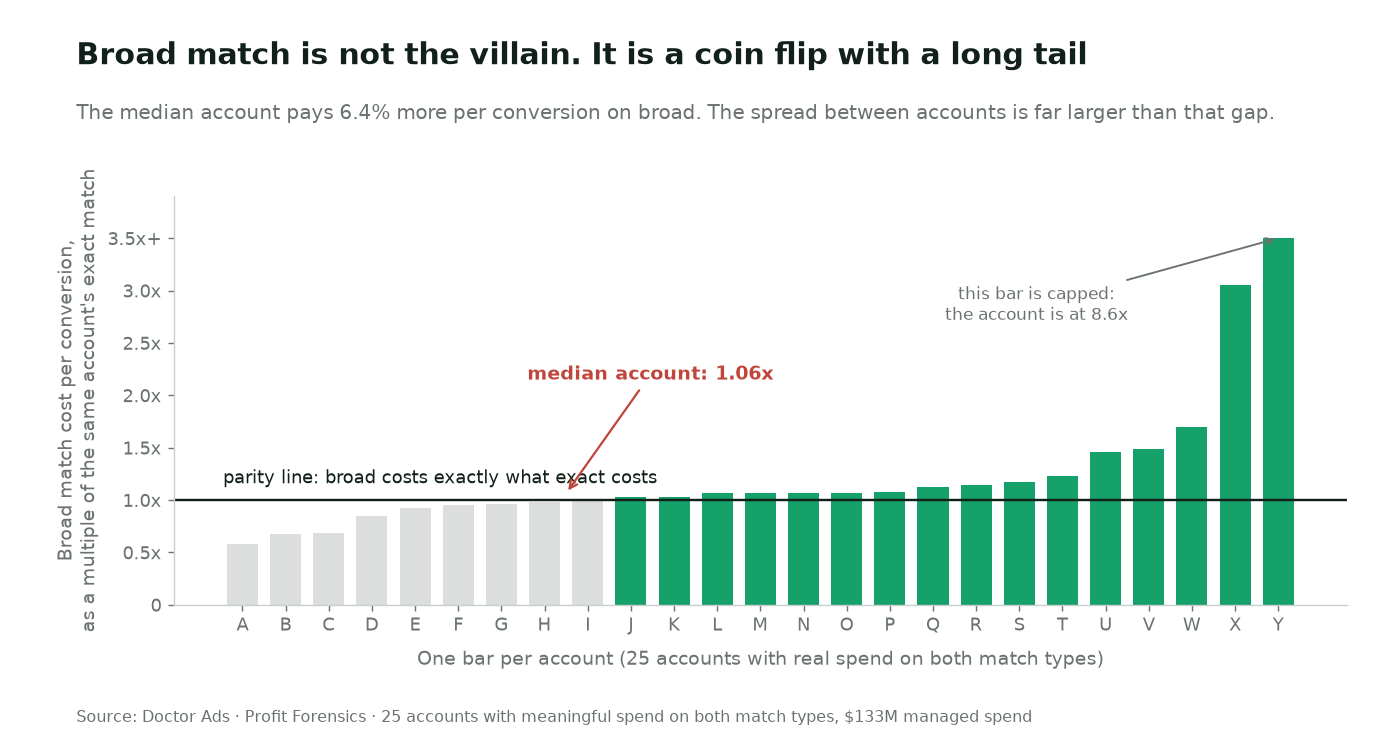
The comparison is deliberately account-local. Cost per conversion means nothing pooled across advertisers, because a local repair shop and a global mobile app do not share a scale. Comparing an account only against itself removes that problem.
Direction agrees with the industry. Magnitude does not
Optmyzr counted winners: in 70.79% of their accounts exact delivered the better cost per action, and among those winners the median improvement was large. Counting winners is the right way to answer “which usually wins”. It is the wrong way to answer “how much is this decision worth in my account”.
Our two thirds is the same answer to the first question, on a much smaller and narrower sample. The second question is where the numbers part company. When you take every account, winners and losers together, and measure the ratio rather than the verdict, the median lands at 1.06x. The typical account is not choosing between cheap and expensive traffic. It is choosing between two options that cost roughly the same, with an occasional account where the choice matters enormously.
Both things can be true at once: exact wins more often, and the average win is small. A win rate is not a magnitude, and most match-type arguments quote the first while implying the second.
The accounts differ more than the settings
Half of these accounts sit between 0.96x and 1.20x. That middle band is the honest headline, because it is where the typical account lives.
The ends are noisier and each is a single account: one at 0.58x, where broad converted at nearly half the cost of exact, and one at 8.63x. Two single observations do not prove an account effect, but they do set the scale of the question. The distance between accounts is bigger than the distance between match types, and no setting in the interface explains it.
What does explain it is not measured here, and I am not going to dress up a guess as a finding. In the accounts I audit, the ones sitting far above parity usually have a structure and negative-keyword problem rather than a match-type problem: broad is reaching queries nobody vetted. That is a hypothesis you can test in your own account in an afternoon, not a result from this data.
What to actually do with this
Run the comparison on your own account first, because your account is the variable with the widest range. Split cost and recorded conversions by match type over a window long enough to hold real volume, then divide broad by exact.
- Read the ratio against your own economics, not against 1.0. A 20% gap is trivial on a fat margin and fatal on a thin one. The band in this study is a screening signal, not a threshold that decides anything for you.
- Check volume, not just cost. Broad usually buys more conversions. If it costs 6% more and delivers 40% more, cost per conversion answered the wrong question.
- Check what the conversions are worth. Recorded conversions are leads, calls and form fills, not revenue. If broad’s leads close at a lower rate, a matching cost per conversion still hides a real gap. Look at qualified or customer-level cost where you can.
- If you land far above 2x, read the search terms before touching the match type. That is usually a negative keyword and structure question, and switching everything to exact hides the symptom instead of fixing the cause.
The same pattern showed up in the two studies before this one: in where the budget actually lands, in when it is spent, and in whether the targets you set are actually met. In each of them the account-level spread was wider than the setting-level difference everyone argues about.
When this does not apply
- Your broad keywords carry almost no spend. Below the volume that makes a ratio stable, this comparison tells you about noise, not about match types.
- Brand traffic sits on one side only. If your exact keywords are mostly your own brand and broad is all prospecting, you are comparing two different businesses, not two settings.
- Your recorded conversions differ in value. A cheaper conversion that never becomes a customer is not cheaper. Where lead quality varies by match type, cost per recorded conversion is the wrong scoreboard entirely.
Key takeaways
- At the median account, broad match cost 6.4% more per recorded conversion than exact, measured within accounts across the managed portfolio.
- Broad was more expensive in two thirds of accounts, the same direction as Optmyzr’s much larger 2,637-account study, which found exact ahead in 70.79%.
- Half of the accounts sat between 0.96x and 1.20x, so for a typical account the two match types cost roughly the same per recorded conversion.
- Individual accounts ranged from 0.58x to 8.63x, a spread far wider than the median difference between the settings.
- Cost per conversion alone does not settle the decision: conversion volume and the quality of what gets recorded decide whether broad is worth its price.
Method and sources
Doctor Ads Profit Forensics is the research desk of a Google Ads practice with 19 years and $770M managed spend behind it.
Figures come from a forensic analysis of a managed portfolio of Google Ads accounts totalling $133M in spend, measured over each account’s primary reporting window, most spanning September 2024 to February 2025. Keyword-level cost and recorded conversions were aggregated by the keyword’s configured match type within each account, and an account entered the comparison only where both broad and exact carried at least 30 conversions and at least $2,000 in spend, leaving 25 accounts of the 30 with keyword-level data. The reported figure is the ratio of that account’s own broad cost per conversion to its own exact cost per conversion, and the median is an equal-weight median of those 25 account ratios, not a spend-weighted portfolio figure. The analysis does not control for brand versus non-brand allocation, bidding strategy, campaign objective or how each account defines a conversion, and any of those can move the ratio; match type is also not randomly assigned, since accounts choose where to point each type. It therefore describes what these accounts did rather than what the settings cause. External comparison: Optmyzr, 2,637 accounts, and its 2024 update; their inclusion rules and metric differ from ours, so the two are directionally comparable but not a trend.


