

TL;DR abstract. A widely repeated practitioner rule says a campaign should optimise toward one meaningful outcome, and the failure mode has a standard name: a polluted primary pool. We found no published multi-account denominator behind it. How many goals is a real campaign marked to bid toward, and what is in there?
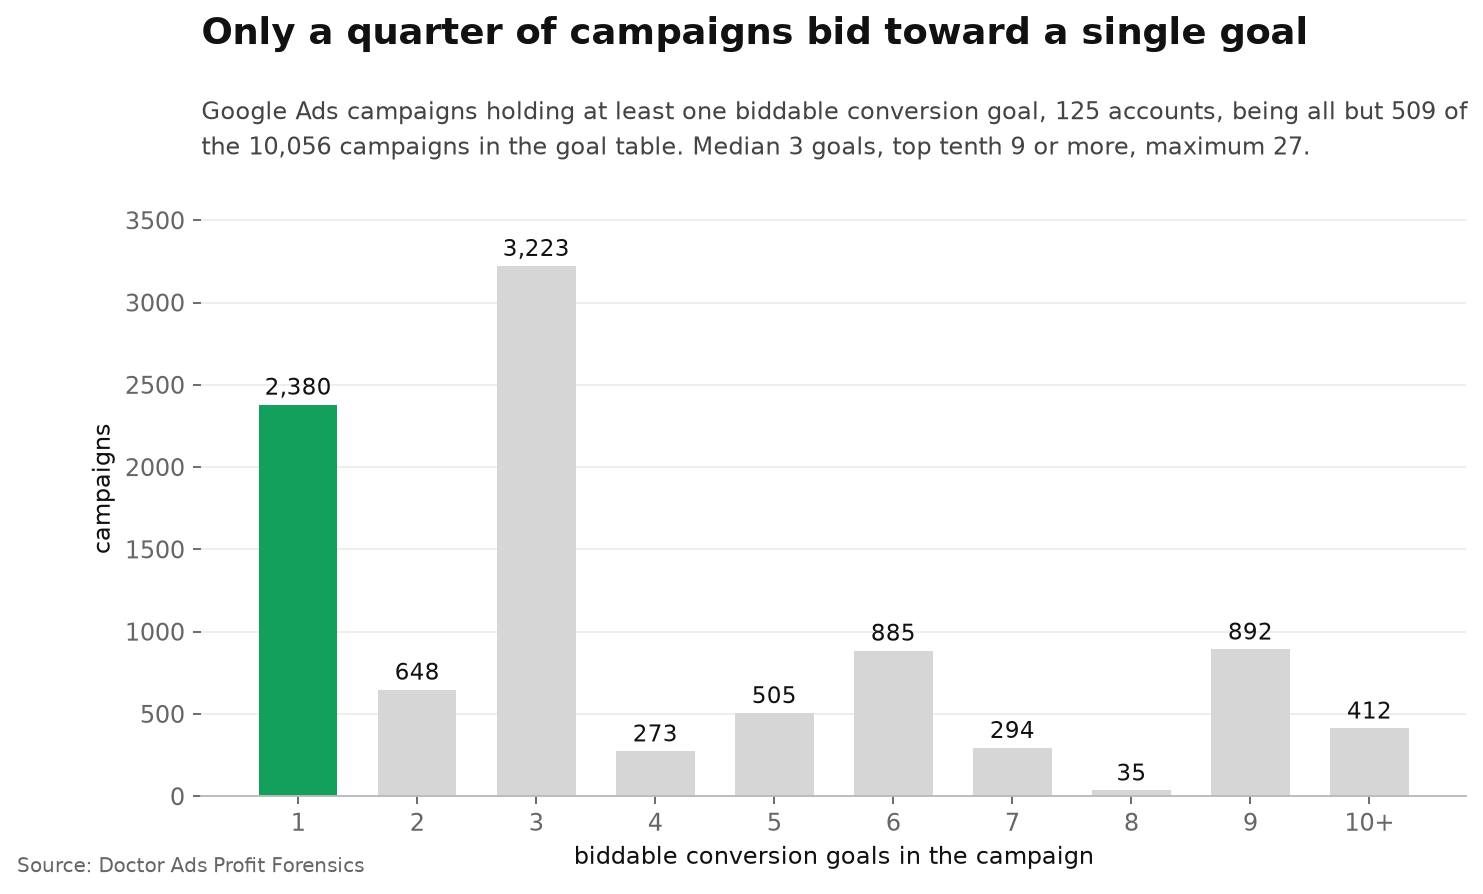
We read the campaign level conversion goal configuration for a managed portfolio: 41,784 biddable goal entries across 125 accounts, covering every campaign in the goal table except the 509 that carry nothing biddable at all. The median campaign in this portfolio is marked biddable on three conversion goals at once. The top tenth carries nine or more, and one campaign carries 27. Only a quarter, 2,380, carry exactly one. Take the narrowest and least arguable cut, the four categories whose labels name no business outcome, which are Page view, Engagement, Outbound click and Other: 37.8% of campaigns have at least one of them marked biddable, and 36.8% have one of those and a sales or lead category marked biddable at the same time. Pooled and per account diverge on that second figure, 36.8% against a median account of 54.6%, and both are printed here. None of this requires anybody to have made a mistake: the API creates a campaign goal automatically, usually biddable, whenever a conversion action arrives with a new category and origin.
The advice is old, correct and unnumbered. This is the number.
Ask an experienced practitioner what breaks Smart Bidding and you will often get a version of the same answer. Too many things are marked primary, the Conversions column becomes a blend of purchases and button clicks, and the algorithm optimises toward the blend. Search Engine Journal puts it directly: a polluted primary pool is the most common cause of Smart Bidding drift, and prescribes one macro goal per campaign with everything else demoted to secondary. That is a practitioner rule, not a platform one, and Google’s own guidance pulls the other way: it recommends keeping the same account-default goals across campaigns so they learn from each other.
It is good advice. It is also an assertion with no measurement behind it, and that gap matters, because the size of a problem changes what you do about it. If two campaigns in a hundred carry a long biddable set, this is a checklist item. If it is a third of them, it is the first thing to look at in an audit.
So we counted, and the object being counted needs naming precisely, because three different things get called goals in this conversation.
A conversion action is one tracked event, and whether it is primary or secondary is a property of the action. We measured those separately. A campaign conversion goal is a different object, and in the API it is the resource CampaignConversionGoal: one row per campaign for each combination of category and origin, carrying a biddable flag that says whether that category is applied to the campaign’s bidding. Those rows are what we read. Every goal entry counted here is one such row; the campaign-level figures below aggregate those rows by campaign, and none of them count conversion actions. A custom goal is a third object, and it is this page’s blind spot: a campaign bidding toward a custom goal optimises to the specific actions inside it, and a secondary action inside a custom goal is used for bidding even though it is secondary. Our export does not expose custom goals across the portfolio, so those campaigns are not visible to this count.
The visible edge of that blind spot is countable. The goal table covers 10,056 campaigns. All but 509 of them carry at least one biddable row, and those are the population of this page. The excluded 509, spread across 29 accounts, carry goal rows with nothing marked biddable, which is what a campaign bidding through a custom goal, or through a configuration this export does not carry, would look like from here.
The median campaign here carries three biddable goals, not one
Across the portfolio, those campaigns sit in 125 accounts and hold 41,784 biddable campaign conversion goal rows between them.
The median campaign carries three. The top decile carries nine or more. The maximum is 27 in a single campaign. At the other end, 2,380 campaigns, 24.9% of the total, carry exactly one, which is what the practitioner rule asks for. Three quarters do not.
Before reading that as sloppiness, note what a goal is. A conversion goal is a bucket, not a single tag: the Purchase goal can hold several purchase actions. Bidding toward two goals can be entirely deliberate, and an ecommerce campaign that bids on Purchase and Subscribe is doing something coherent. The question is not the count on its own. It is what is inside the pool.
A third carry a category whose label names no outcome
Google groups conversion categories into Sales, Leads and a set of further categories. Sales holds Purchase, Add to cart, Begin checkout and Subscribe. Leads holds Submit lead form, Book appointment, Sign up, Request quote and the qualified and converted lead categories. The further group holds Get directions, Outbound click, Contact, Page view and Other.
Where you draw the line inside that third group is arguable, so we drew it in the least arguable place available and pre registered it before running the query. Four category labels name no downstream business outcome under any reading: Page view, Engagement, Outbound click and Other. That is a statement about the label, not about the action underneath it: a genuine lead form can sit under Page view because of how somebody set it up years ago, and this data cannot see that.
3,611 campaigns, 37.8% of the portfolio, carry at least one of those four in their bidding pool. In the median account it is 64.6% of campaigns, with the middle half of accounts running from 0.0% to 98.9% and a leave-one-account-out range of 63.6% to 65.6% across the 106 accounts with at least five campaigns.
36.8% of campaigns have both a sales or lead category and one of those four marked biddable. That is the shape that matters, and it is not a campaign that has lost the plot and optimises purely for page views. It is a campaign where purchases and page views are both applied to the bidding at the same time. How much each one then influences the bid depends on values, volume and strategy, none of which this export carries, so no claim is made here that they weigh the same.
Pooled and per account differ here, and both belong on the page. Pooled, 36.8% of campaigns. In the median account it is 54.6% of its campaigns, with the middle half of accounts running from 0.0% to 95.3% and a leave-one-account-out range of 49.2% to 60.0% across the 106 accounts with at least five campaigns. The spread is the familiar one: a large group of accounts do this in nearly every campaign and another large group in none, and the pooled figure sits below the median because the accounts doing it least carry more campaigns.
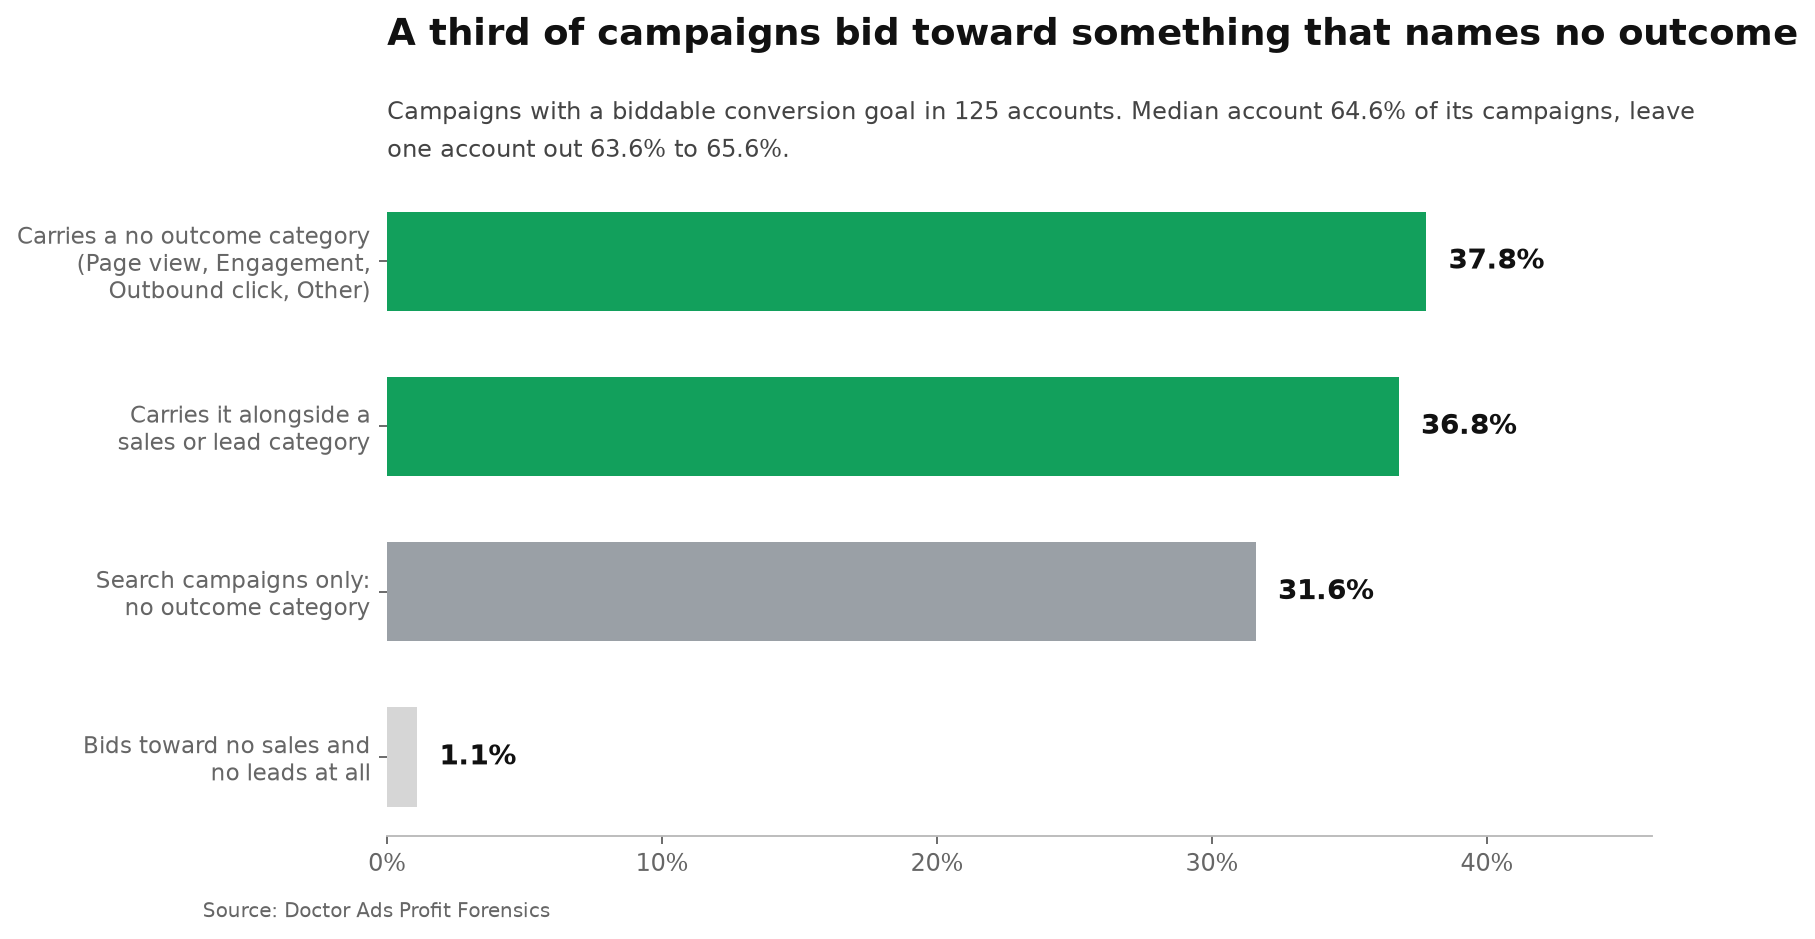
Because taxonomy arguments are the fastest way to lose a reader, here are the two wider readings as well, and you can pick. Taking Google’s grouping literally, where Contact sits under further categories, 71.0% of campaigns carry a further category goal. Treating Contact as a lead, which is how most advertisers use it, gives 41.6%. Our narrow four category cut gives 37.8%. Every version of the line lands between a third and three quarters, and the conclusion does not depend on which one you accept.
It is not a Performance Max artefact
The first objection worth taking seriously is that this is an automation artefact. Performance Max and Demand Gen campaigns get their goal sets assembled with more help from Google, so perhaps the padding is concentrated there and Search is clean.
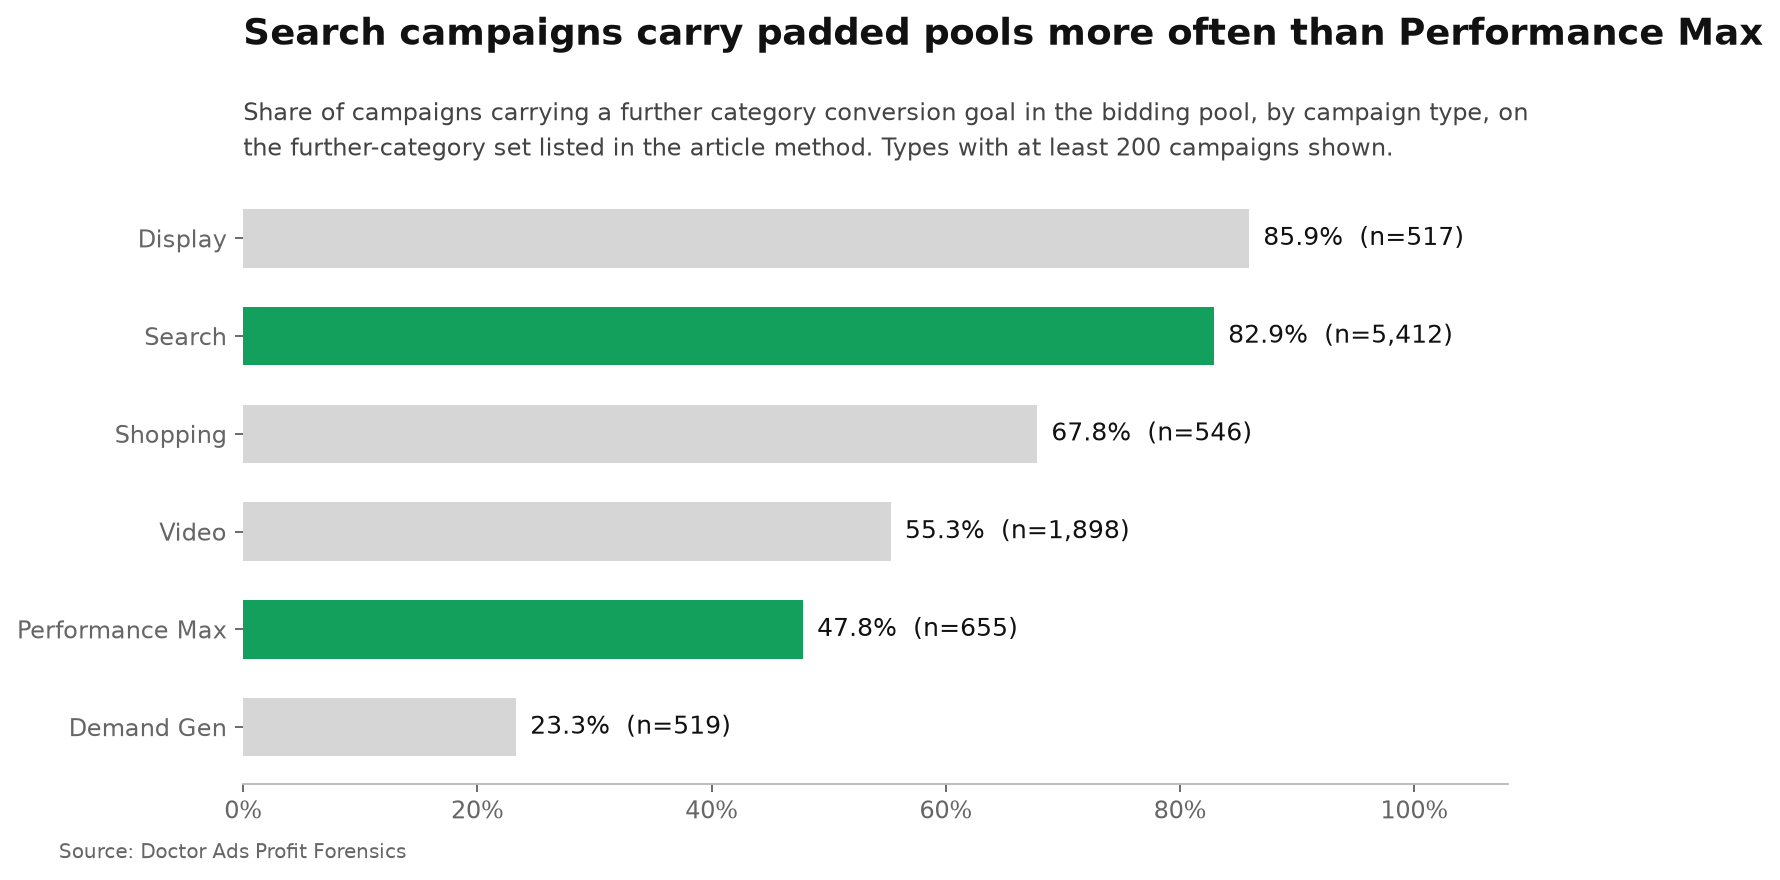
It is the other way around. On the wide reading, Performance Max sits at 47.8% and Search at 82.9%: the manual type does this far more often than the automated one. Across all types the highest is Display at 85.9% and the lowest is Demand Gen at 23.3%, so the ordering is not a simple automation gradient either.
Search campaigns on their own, all 5,412 of them, give 31.6% carrying a no-outcome label and 30.8% carrying it alongside a sales or lead category. Page view specifically appears in the biddable set of 13.4% of Search campaigns. The pattern is common in the type advertisers configure most by hand, so it is not something confined to the automated types.
One documented mechanism fits, and it is not ignorance
None of this requires anybody to have made a mistake, and that is the most useful thing on the page. Two documented behaviours would produce a pattern like this without anybody deciding anything. Google’s help centre states that account-default goals are pre-selected when you create new campaigns, so whatever set the account carries becomes the starting pool for the next one. And in the API, a campaign conversion goal is created automatically, usually biddable, whenever a conversion action arrives with a category and origin combination the campaign has not seen before. Add a tag, and a goal appears in the pool.
That is a mechanism that fits, not a mechanism we measured. To prove inheritance you would need each campaign’s goal configuration level and its creation date, and this export carries neither.
The distinction between the two states is not cosmetic, and Google’s own page on primary and secondary conversion actions is blunt about it. Primary actions are “used for bidding as long as the standard goal they are part of is used for bidding” and appear in the Conversions column. Secondary ones are “not for bidding, even if the goal they are included in is used for bidding”, and live in All conversions instead. The setting decides what the bidding sees.
There is a fair counter argument here and it comes from Google rather than from us. The help centre actively recommends the account level route: “in general, it’s best to use your account-default goals across all your campaigns rather than creating campaign-specific goals, since this allows your campaigns to learn from one another”. Consistency across campaigns is a real benefit, and a portfolio of individually tuned pools has costs of its own. That argument is about consistency, though, not about contents. It is a reason to set the pool once at account level. It is not a reason for the pool to contain a page view.
We are going to call the pattern the Pre-Selected Pool, after the mechanism rather than the symptom. Concentration is consistent with it: Page view is marked biddable in 1,776 campaigns across only 26 accounts, Engagement in 937 campaigns across 21 accounts, Outbound click in 648 across 13. Whatever produced these pools, the result clusters by account rather than scattering across campaigns.
For completeness in the other direction: Purchase is the single most common biddable category, in 7,420 campaigns across 71 accounts, and only 109 campaigns, 1.1%, carry no sales and no lead category at all. The pools are not junk. They are long.
When this does not apply
You are running a genuine upper-funnel campaign. If the objective really is engagement or traffic, then Engagement or Page view is the honest goal to bid on and the pool is correct. What the data cannot separate is a deliberate awareness campaign from a lead generation campaign that inherited an awareness goal.
Your conversion actions are labelled loosely. The category is a label somebody applied or Google suggested. If your genuine lead form sits under Page view because of how it was set up years ago, your pool is fine and your labelling is not. Either way the audit starts in the same place.
You bid on several goals on purpose with values attached. Value based bidding across a set of goals with different conversion values is a real strategy, not a mistake. The number to check then is whether the values are set, not whether the pool is short.
How to read your own pool in about five minutes
- Open Goals, then Conversions, then Summary, and read which conversion actions are marked primary. That is the account-level starting point, not yet the answer for any given campaign.
- Open the campaign’s settings and read its conversion goals. A campaign can use the account defaults, override them with campaign-specific goals, or bid toward a single custom goal, and only that screen tells you which. If it uses the defaults, what you saw in step one is what it bids toward.
- Count the categories in the pool that name no outcome: Page view, Engagement, Outbound click, Other. In this portfolio, more than a third of campaigns have at least one.
- Demote rather than delete. Moving an action to secondary keeps it in All conversions for reporting and takes it out of the bidding column. One exception matters: an action sitting inside a custom goal is used for bidding even when it is marked secondary, so check whether the campaign bids toward a custom goal before you assume demotion did anything.
- Change one thing and wait. Changing which goals are biddable changes what the bidding optimises toward, so treat it as a bidding change that may need a period of adjustment, and watch the campaign afterwards rather than judging it the next morning.
Key takeaways
- In this portfolio the median campaign carries three biddable conversion goals; the top tenth nine or more; only 24.9% carry one.
- 37.8% of the campaigns studied carry a category whose label names no outcome, meaning Page view, Engagement, Outbound click or Other; 36.8% carry one alongside a sales or lead category, against a median account of 54.6%.
- Median account: 64.6% of its campaigns, leave one account out 63.6% to 65.6%.
- It is not confined to the automated types: Search 82.9%, Performance Max 47.8% on the wide reading.
- Two documented behaviours fit: account-default goals are pre-selected on every new campaign, and the API creates a biddable campaign goal automatically for each new category and origin.
Researcher’s take
What changed my mind while writing this was the account count behind Page view: 1,776 campaigns, 26 accounts. Whatever is happening is happening at account level, and that is enough to make the standard advice suspect without proving anything about intent. One macro goal per campaign is aimed at the campaign, and the pool does not appear to be assembled there. So the check I would actually run is one level up: open the account-default goals once, read what is marked biddable, and decide there. If I am right about the mechanism, the next fifty campaigns inherit whatever you leave there, without anybody touching them again. If I am wrong, you have lost five minutes and learned what your account defaults are, which most people reading this cannot say offhand.
Igor Ivitskiy, Doctor Ads
Method
Data statement v.2026.09. Source: the Google Ads API campaign conversion goal resource for a managed portfolio, one snapshot dated 10 July 2026. Unit of analysis is one row, meaning one campaign with one category and origin combination. Population is campaigns holding at least one row flagged biddable: 41,784 rows across 125 accounts, being all but 509 of the 10,056 campaigns present in the table. Accounts are pseudonymised, and no account, brand, vertical, campaign or conversion action name is published.
Definition and pre-registration. The four-category no-outcome set, Page view, Engagement, Outbound click and Other, was fixed before the query ran. So that every figure on this page reproduces from it, here is the complete mapping actually used, in the API’s category names. Sales or lead: PURCHASE, ADD_TO_CART, BEGIN_CHECKOUT, SUBSCRIBE_PAID, STORE_SALE, STORE_VISIT, QUALIFIED_LEAD, CONVERTED_LEAD, SUBMIT_LEAD_FORM, BOOK_APPOINTMENT, SIGNUP, REQUEST_QUOTE, PHONE_CALL_LEAD, IMPORTED_LEAD, CONTACT. No outcome: PAGE_VIEW, ENGAGEMENT, OUTBOUND_CLICK, DEFAULT. Four categories present in the data fall in neither set and are counted in neither: DOWNLOAD, GET_DIRECTIONS, YOUTUBE_FOLLOW_ON_VIEWS and UNKNOWN. The two wider readings use Google’s further categories as they appear in this data, meaning the four no-outcome categories plus CONTACT, GET_DIRECTIONS, DOWNLOAD, YOUTUBE_FOLLOW_ON_VIEWS and UNKNOWN: on that set the figure is 71.0%, and moving CONTACT into leads gives 41.6%. We did not audit what any conversion action fires on; the category is the label carried in the account.
Weighting. Headlines are reported pooled across campaigns and as the median across the 106 accounts with at least five campaigns, with leave-one-account-out ranges. Where the two diverge, both are printed. The mixing figure is quoted both ways: 36.8% pooled against a median account of 54.6%, leave-one-account-out 49.2% to 60.0%.
Counter hypothesis. The proposed alternative was that long biddable sets are an artefact of campaign types where Google assembles goals automatically. It was tested by splitting the population by campaign type and rejected: Performance Max sits at 47.8% against Search at 82.9%. Across all types the highest is Display at 85.9% and the lowest Demand Gen at 23.3%, so the ordering is not an automation gradient in either direction.
Selection note. Agency managed portfolio, not a random sample of advertisers. We did not measure which way that selection cuts.
Limitations. Five, and the first is the one that bounds everything else. Custom goals are invisible here. A campaign bidding toward a custom goal optimises to the specific actions inside it, and the actions inside it are used for bidding whatever their primary or secondary status; our export does not carry custom goals across the portfolio, so those campaigns cannot be described by this count. The visible edge of that gap is the 509 campaigns in 29 accounts that hold goal rows with nothing biddable. Second, the category is a label somebody applied, not an audit of what the tag fires on. Third, the biddable flag arrives from the export as true or empty, and empty is read as not biddable, which would understate rather than overstate our figures. Fourth, a multi-goal pool is not an error in itself and this page does not claim it is; how much each category influences a bid depends on values, volume and strategy, none of which this export carries. Fifth, no performance comparison is made between long and short pools, because nothing in this snapshot supports a causal read.
Changelog. First published September 2026. Recomputed quarterly against the live claim registry.
What to read next
- Which Google Ads metric actually matters, the wider question this sits under.
- What sits inside the Conversions column, the companion measurement on conversion actions rather than goals.
- Optimization score against actual performance, if you are auditing what the platform recommends.


