

TL;DR abstract. In its geographic report Google labels rows by whether it placed the person in the location you targeted or only judged them interested in it. Doctor Ads Profit Forensics added up both sides across its managed portfolio for January to June 2026. Interest, rather than presence, accounted for 5.33% of measured spend in the pool, and 8.94% once the single largest spending account is removed. The median account sat at 2.55%, with the middle half between 0.24% and 11.09%.
The distribution matters more than the average. About one account in five recorded no interest spend at all, while one in ten were above 25% and the highest reached 67.8%. Those clicks are also more expensive: $1.42 against $0.79 for a presence click, which is 1.79 times the price. This is a measurement of where money landed, not an audit of anyone’s settings, and interest traffic is not automatically waste: Google’s own numbered result runs the other way.
Google Ads uses presence and interest in two different places, a targeting setting and a report, and neither confirms where anyone physically stood: Google infers it. One is a setting: your campaign can reach people “in, regularly in, or who’ve shown interest in your targeted locations”, which Google calls Presence or Interest and marks as the default and recommended option, or people “in or regularly in your targeted locations”, which it calls Presence. The other is a report: after the auction, Google classifies each row as location of presence or area of interest. Matched locations, in Google’s words, “could be users’ physical locations or locations of interest.”
This article is about the second one. We are not counting how many advertisers changed a setting, because that field is not in our export. We are counting what the money did.
5.33% of spend, or 8.94% without one account
Across the portfolio accounts with geographic data in the first half of 2026, rows labelled area of interest carry $224,246 of $4,205,731, which is 5.33%.
That figure is fragile in a specific way, and we would rather say so than let a reader find out later. One account dominates the pool. Remove it and the same ratio becomes 8.94%. Both numbers describe the portfolio; neither describes an account. For that we need the distribution.
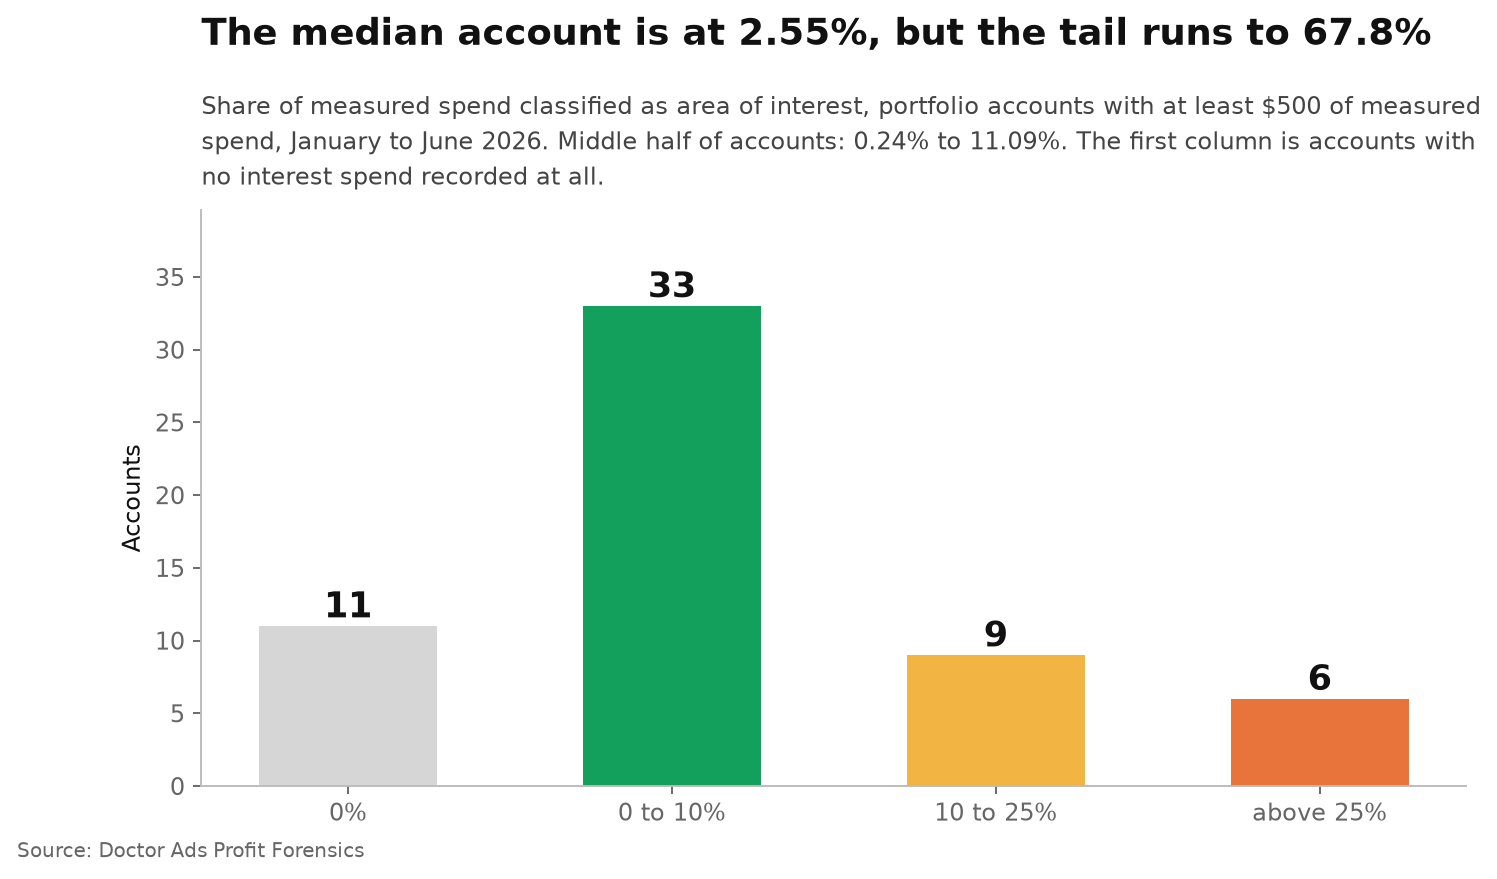
The median account is at 2.55%, and the tail runs to 67.8%
Among the portfolio accounts that spent at least $500 inside the window, the median share of spend going to interest rather than presence is 2.55%, with the middle half between 0.24% and 11.09%. Leaving any single account out moves that median only between 2.44% and 2.61%.
Underneath that steady median is a split population. About one account in five recorded no interest spend at all. At the other end, about a quarter were above 10%, one in ten were above 25%, and the highest devoted 67.8% of its measured spend to rows classified as area of interest.
A zero here is ambiguous and we treat it as such: it may mean the advertiser restricted targeting to presence, or simply that no interest traffic arose. The export does not record the setting, so we cannot separate the two.
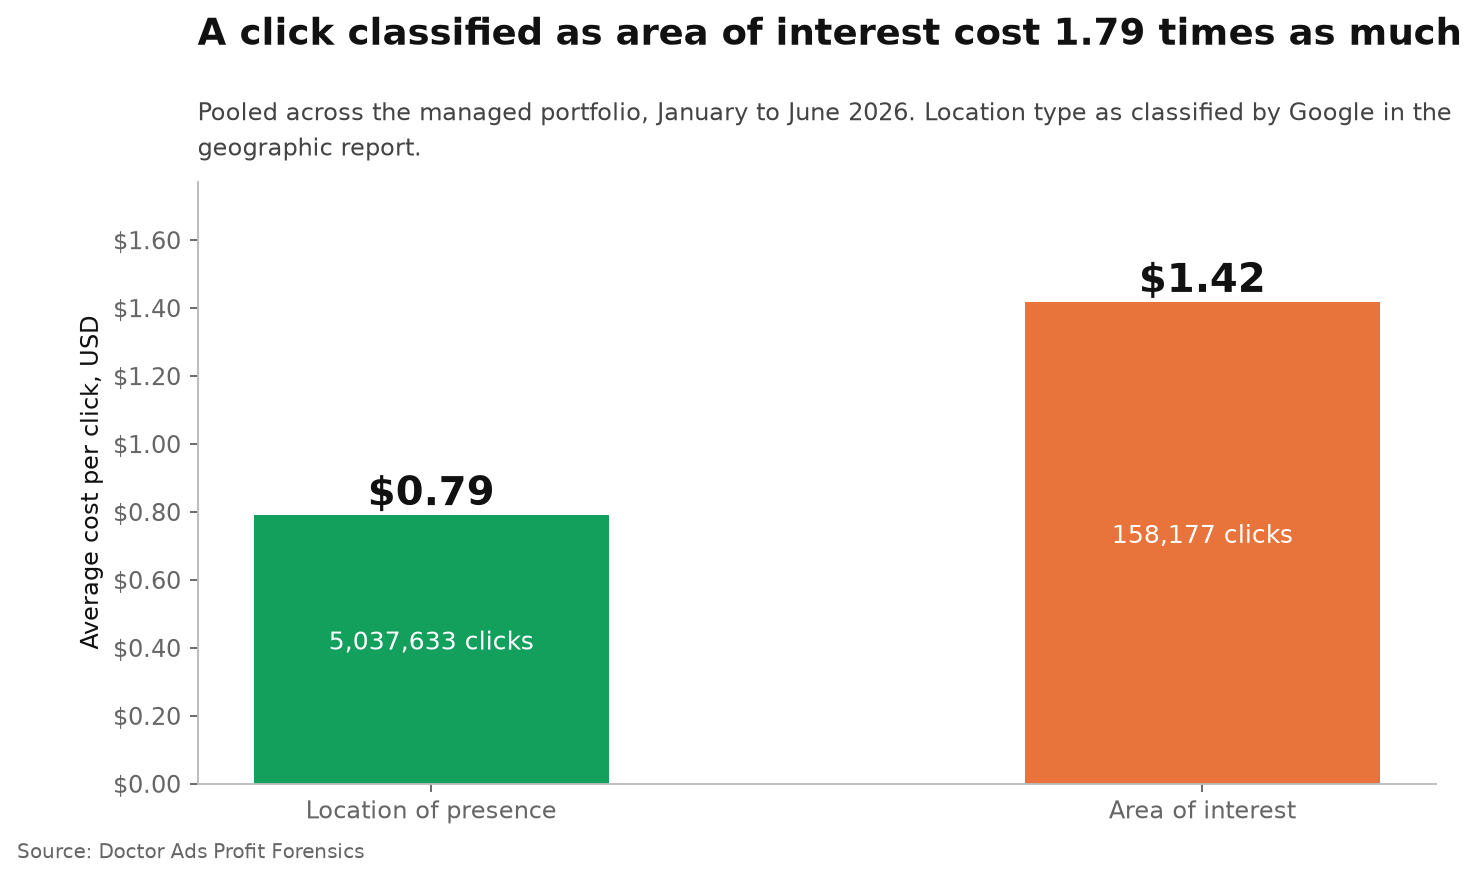
Pooled, an interest click cost 1.79 times a presence click
The more useful number is not the share but the price. Pooled across the same window and the same accounts, a click from an area of interest row cost $1.42. A click from a location of presence row cost $0.79. That is 1.79 times as much for a click classified as area of interest.
We are not going to dress that up as a finding about any one account. This is an unadjusted comparison of two pooled sets of report rows: the two groups differ in campaign type, in query, and in which advertisers contribute most of the volume, and none of that is held constant here. What the ratio establishes is that across this portfolio the rows labelled interest were the more expensive rows. Whether that holds inside your account is a question for your own report, and switching a setting would not mechanically reproduce this gap.
The interest share is 6.23% in Performance Max and 3.12% in Search
The obvious counter hypothesis is that this is an artefact of automated campaign types, and Search is clean. We tested it, and it half holds.
Performance Max campaigns show 6.23% of spend on interest rows. Search campaigns show 3.12%. Demand Gen shows 0.0%. So automation does carry more of it, roughly twice the Search rate, and Search is not at zero either. Campaign types present in fewer than three accounts are suppressed entirely, including their percentages.
The share has risen about 70% since 2023
Measured in the same way on each window, the pooled share runs 3.13% in 2023, 3.30% in 2024, 3.93% in 2025 and 5.33% in the first half of 2026, an increase of roughly seventy per cent rather than a doubling. Each of those figures is pooled and carries the same fragility as the headline: in the current window, removing the largest account moves it to 8.94%. The set of accounts also changes between windows, so this is a portfolio level observation and not a trend inside the same advertisers.
Is interest traffic waste?
The internet says yes with great confidence. A steady stream of agency posts recommends switching every campaign to Presence, usually quoting a figure of 20% to 30% out of area clicks from audits whose sample size is never stated, and usually measuring a different report than this one.
The only numbered result we could find that isolates the setting belongs to Google, and it runs the other way: advertisers in Travel, Real Estate and Education who switched from Presence to Presence or Interest saw 5% more conversions on Search, according to Google internal data from May and June 2022 cited on its own help page.
Both can be true. A plumber in one city has no use for a person in another country reading about that city. A hotel in that city has nothing else to sell. That is exactly why a portfolio average is the wrong unit and the distribution is the right one: the question is not what the typical advertiser does, it is which group yours belongs to.
One correction worth making while we are here, because it circulates a lot: the third option, Search interest, was not removed in 2020. Google removed it in March and April 2023 and migrated those campaigns to Presence or Interest automatically. The 2020 change was a reporting consolidation, which is why the split became harder to find in the interface.
When this does not apply
You sell to people who travel to you. Hotels, clinics with international patients, universities, relocation services. Interest traffic is your market, and a high share is the product working, not leaking.
You want to know your setting, not your outcome. This measurement cannot tell you which location option a campaign uses. Presence only campaigns can still record some interest rows, and a Presence or Interest campaign is not 100% interest. Read the setting in the campaign, read the outcome in the report, and do not substitute one for the other.
You are comparing against the 20% to 30% figure from agency posts. Those count clicks whose user location sits outside the targeted area in the user location report, on locally selected accounts, without published samples. Different report, different denominator, different population.
Your account is small. Accounts below $500 of measured spend in the window are excluded from the per account figures, because a single stray click moves a small account’s percentage by a lot.
How to check yours in two minutes
- Open Report Editor, build a report on the geographic view, and add the location type dimension. The two values you want are location of presence and area of interest.
- Set the date range to the last six months, put cost and clicks in the columns, and read the interest row as a share of the total.
- Divide cost by clicks on each row separately. The gap between the two prices tells you more than the share does.
- Only then open the campaign settings and look at the location option. If interest is a large share and your business cannot serve people elsewhere, that is where you change it.
Key takeaways
- 5.33% of first half 2026 spend across the managed portfolio went to people classified as interested rather than present, and 8.94% without the largest account.
- The median account sits at 2.55%, but about one in five accounts are at zero and one in ten are above 25%, with a maximum of 67.8%.
- An interest click cost $1.42 against $0.79 for a presence click, which is 1.79 times the price.
- Performance Max carries 6.23% against Search at 3.12%, so automation holds more of it but Search is not clean.
- Google’s default is Presence or Interest, and Google’s own result for Travel, Real Estate and Education is that including interest raised conversions by 5%.
Researcher’s take
I do not switch this setting by reflex, and I have watched people lose volume doing it. What I do is look at the price of the two rows before touching anything. If the interest click costs nearly double and the business cannot serve anyone outside its city, the decision makes itself in about a minute. If the business ships nationally, or people travel to it, the same number is simply the cost of reaching them early. The setting is a business question wearing a technical costume, and the report answers it faster than an argument does.
Igor Ivitskiy, Doctor Ads · 19 years · $770M managed spend
Method
Doctor Ads Profit Forensics is the research desk of a Google Ads practice with 19 years and $770M managed spend behind it.
Data statement v.2026.09. Source: the geographic report of a managed Google Ads portfolio analysed by Doctor Ads Profit Forensics, rows carrying Google’s location type classification, for January to June 2026. $4,205,731 of measured spend and 5,195,810 clicks fall in the window. Accounts are pseudonymised; no account, campaign or vertical name is published. Spend is normalised to US dollars at fixed rates.
Definitions. Location of presence marks rows where Google classified the person as in or regularly in the targeted location; area of interest marks rows classified by interest rather than presence. These labels are Google’s inference, not independently verified physical locations. Share of interest is interest cost divided by the sum of both types, which is why it is described throughout as a share of measured spend rather than of total account spend: rows without a location type classification are outside this denominator. Per account figures use the portfolio accounts with at least $500 of measured spend in the window; there were 59 of them. Medians and quartiles use a single engine, quantile_cont. Campaign type comes from joining each row to its campaign; types present in fewer than three accounts are suppressed.
Limitations. Four. The campaign location option is not in the export, so an account at zero cannot be separated into restricted targeting and absent traffic. The price comparison is pooled, not a per account median, and campaign mix is not controlled. Yearly windows contain different sets of accounts. And the portfolio is agency managed, not a random sample of advertisers.
Changelog. First published September 2026. Recomputed quarterly.
What to read next
- How much of a Google Ads budget goes to zero conversion queries, the same portfolio measured on a different kind of leak.
- Who actually took the Search partners opt out, on another default that quietly widens where ads appear.
- What a normal cost per click looks like across accounts, for context on the two prices above.
