
TL;DR abstract. In November 2023 the Google Search Partner Network became front-page news in ad tech, and within weeks Google opened an opt out to campaign types that had never had one. The obvious follow-up question never got a denominator. Adalytics reported spend shares for the campaigns it examined, and Google reported reach; nobody published what share of campaigns actually took the opt out. Google Ads Help still states that “when you create a campaign for the Search Network, search partners are included by default”, so every campaign starts opted in, and somebody has to go and change it.
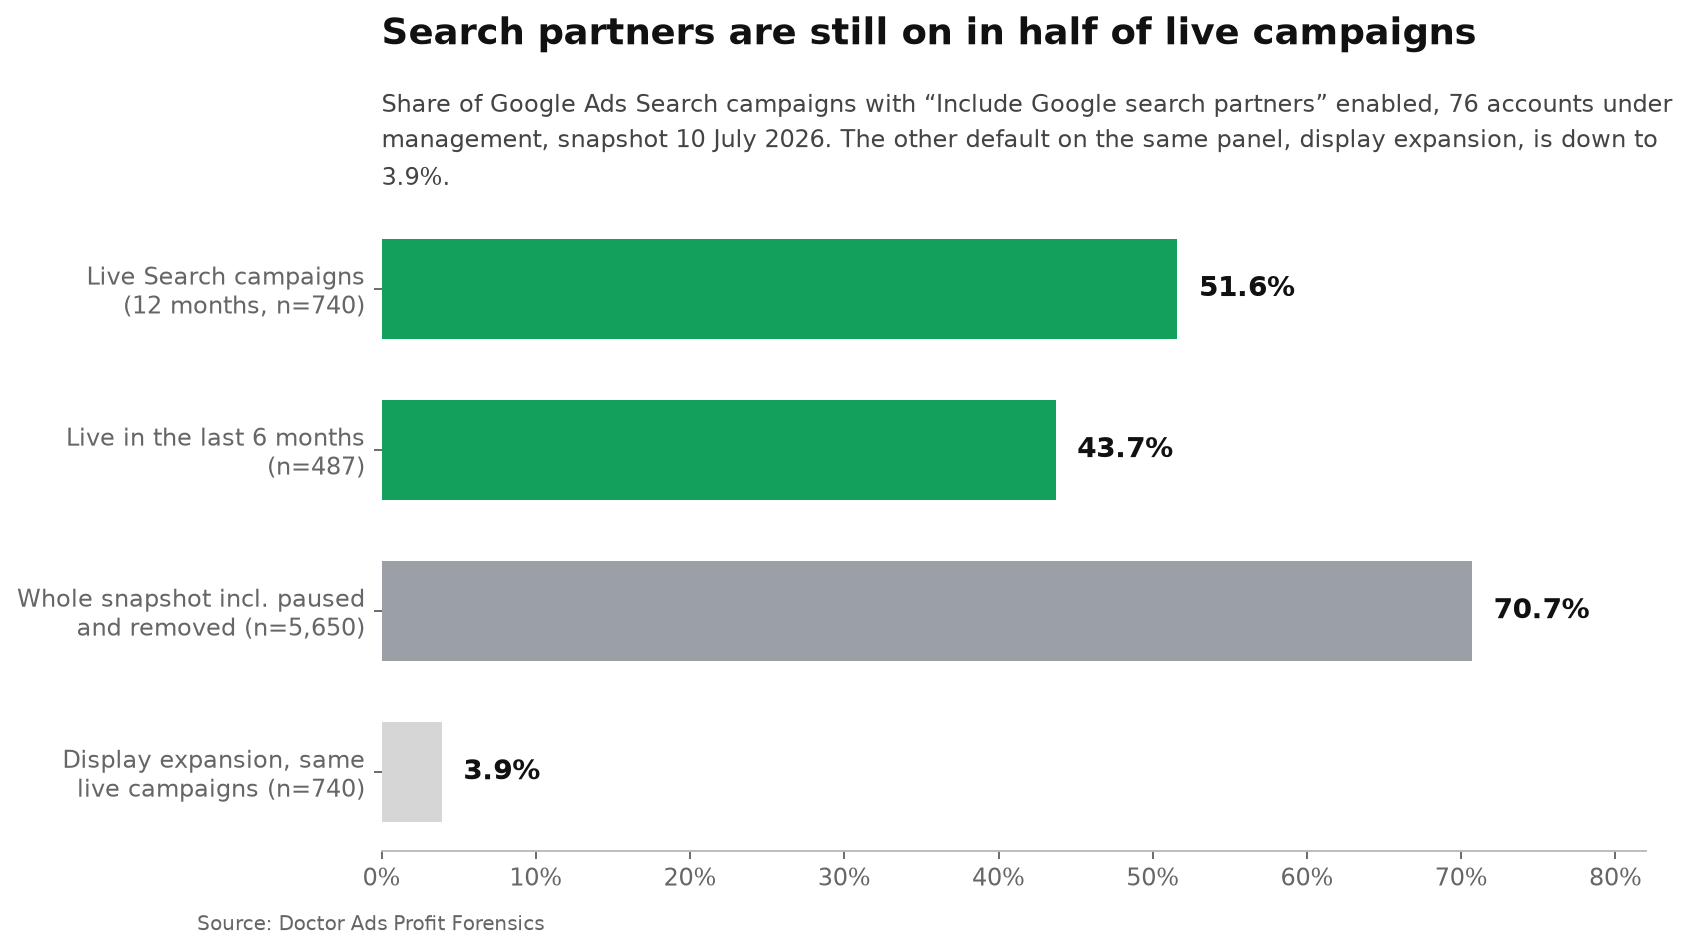
We read the network setting on every Search campaign in a managed portfolio that spent money in the twelve months to July 2026: 740 campaigns across 76 accounts, $4.05M of spend. 51.6% of them still include search partners. The interesting part is not the average, it is the shape. In the median account the figure is 33.3% of campaigns, with the middle half of accounts running from 0.0% to 86.4%, and the distribution is bimodal: 15 of 42 scored accounts have partners off in every live campaign, 9 have them on in every one. The setting behaves like an account-level property rather than a campaign-level one, though a snapshot cannot tell you which decision produced it. Meanwhile the other default checkbox on the same screen, display expansion, is down to 3.9% of campaigns and 0.4% of spend. One default is now rare and the other is not, and this page does not establish why.
Three years of coverage, one checkbox, and no published count of who changed it.
On 28 November 2023, the research firm Adalytics published a report on the Google Search Partner Network, the pool of non-Google sites and apps that can serve your search ads. It estimated the programme at roughly $10.5 billion a year and said that between 6% and 8% of the supply inside it was brand-unsafe. Google disputed the methodology in strong terms. The World Federation of Advertisers responded the next day, and the story ran through the trade and general press for weeks, including a detailed account in Adweek. Then, on 6 December, Google extended the opt out to campaign types that had never had one, including Performance Max and App campaigns, and gave buyers until 1 March 2024 to use it. In August 2025 Google went further and shipped full placement reporting for the network on Search, Shopping and App campaigns.
Search campaigns were not the ones missing the control. The opt out Google extended in December 2023 went to campaign types that had not had one, and Search was not in that set: it has the checkbox in the Networks panel. What it has instead is a default, and Google states it plainly in the help centre: search partners are included by default when you create the campaign. So the question that follows three years of coverage is not whether the control exists. It is whether anybody used it, and what the pattern of use looks like inside real accounts.
That question has an answer in the data every agency already holds, and as far as we can find nobody has published it. This page is the count. We are not rerunning the Adalytics investigation, we are not assessing traffic quality, and we have no opinion here on whether partner traffic is good or bad for you. We are reading one boolean field on 740 live campaigns.
Half of live Search campaigns still include partners
Start with the population, because it does most of the work. The snapshot holds 5,650 Search campaigns across 117 accounts, but most of them are paused or removed: an archive of everything the portfolio has ever run. Counting settings in an archive tells you about history, not about today. So we kept only campaigns that recorded spend in the twelve months to the snapshot date. That leaves 740 campaigns in 76 accounts, carrying $4.05M.
Of those, 382 campaigns, or 51.6%, have “Include Google search partners” switched on. Remove the single largest account by spend and the figure is 50.7%, so this is not one client dragging the number. Narrow the window to the six months to July 2026 and it is 43.7% of 487 campaigns in 63 accounts, which is the same story with a shorter memory.
For contrast, the archive figure across all 5,650 Search campaigns, live and dead, is 70.7%. The flag is more common in the archive than in the spending subset. That is one snapshot compared with itself, not a time series: campaign age, account composition and which campaigns survived all differ between the two groups, so this page cannot establish when or why the difference arose.
The setting is polarised at account level
Here is where the pooled number stops being the interesting one. Score every account with at least three live Search campaigns and you get 42 accounts. In the median account, partners are on in 33.3% of live campaigns. The middle half of accounts runs from 0.0% to 86.4%, which is not a spread so much as an absence of a middle. Leave one account out and recompute the median 42 times, and it does not move at all: the range is 33.33% to 33.33%.
Fifteen of the 42 accounts have partners off in every single live campaign. Nine have them on in every single one. That is 24 of the 42 sitting at exactly zero or exactly one hundred. What the eighteen in between are doing is not visible here. This export carries no campaign creation date and no setting change history, so a partly swept account and an account making genuine campaign level choices look identical.
We are going to call this the Half-Taken Opt-Out, and the name is about the shape, not the average. Three explanations fit a distribution like this and the data separates none of them: a deliberate account-wide policy, a one-off sweep after somebody read about the network, or nobody ever touching the box so every campaign kept the default. What the shape does not look like is a portfolio where each campaign was judged on its own numbers, though a snapshot cannot exclude that either.
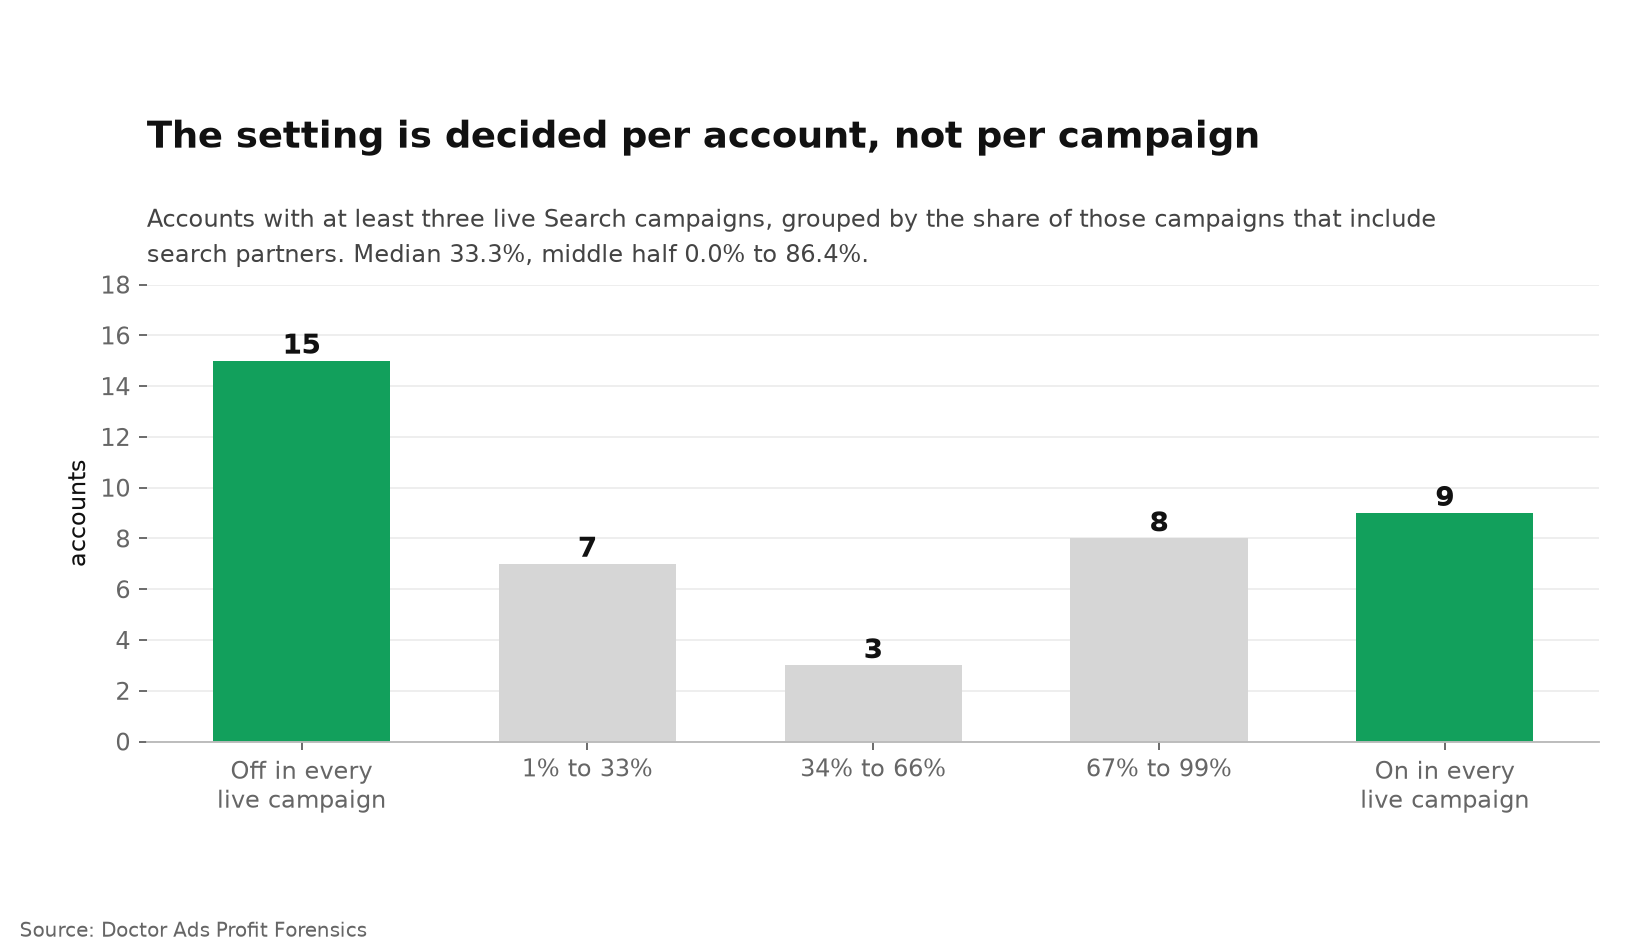
The practical consequence is about where to look. If you are auditing an account, this is not a setting to check on your top campaign. It is a setting to read across the whole campaign list at once, because in more than half of the accounts scored here the answer was the same in every campaign.
The money figure is real and it belongs to one account
The obvious next number is how much spend sits on partner-enabled campaigns, and this is where we have to be careful in public, because the honest answer has two halves.
Pooled across the portfolio, campaigns with partners on carry 62.0% of the $4.05M. Remove the single largest account and that collapses to 34.0%. A number that halves when you drop one account is a fact about that account, not about the portfolio, and publishing only the first half would be the more quotable choice and the wrong one.
The version that survives the test is the equal-account one. In the median account, 21.6% of live Search spend runs through partner-enabled campaigns, with the middle half from 0.0% to 99.6% and a leave-one-out range of 16.7% to 26.6%. Same bimodal shape as the campaign counts, same reason.
We also checked whether any of this is simply a function of account size, on the theory that big accounts have more legacy campaigns nobody revisits. It is not. Split the accounts into three groups by spend and the median partner share of spend runs 13.3%, then 36.6%, then 9.1%. That is not monotonic, so account size does not explain the pattern in this sample. It is not evidence that size is unrelated either; three terciles of 14 accounts cannot carry that.
One default died, the other did not
The same Networks panel used to carry a second pre-ticked box: display expansion, which lets a Search campaign spill into the Display Network. In this portfolio it is effectively extinct. 3.9% of live Search campaigns have it on, and they carry 0.4% of the spend.
That contrast is the most useful thing on this page, because both settings were defaults on the same screen and only one of them is still common. Why they diverged is not measured here, and two hypotheses are worth stating as hypotheses. The first is that display expansion produces visible damage fast: placements you can see, traffic you can recognise as wrong, and a report that names it. The second is that Google itself moved. Since 2025, new Search campaigns no longer arrive with the Display Network checkbox pre-selected, though it still carries a “Recommended” label and Google has not confirmed this globally.
Search partners had neither of those advantages. For years the network was reported as one blended line with Google search, so a campaign could not show you what partner traffic was doing on its own, and the box stayed ticked by default. The reporting half of that changed in August 2025, when placement-level reporting arrived for Search, Shopping and App campaigns, with a Performance Max split following in January 2026. The default half did not change.
When this does not apply
You have looked at the numbers and kept partners on deliberately. That is a legitimate position, and nothing here measures whether partner traffic performs for you. A setting census cannot tell you that. Your campaigns are still counted in this census, because it counts the setting and not the reasoning behind it; nothing on this page implies you should change it.
Your accounts are mostly Performance Max or Shopping. This count covers Search campaigns only. Those types got their opt out later and it works differently, and the January 2026 Performance Max reporting split is new enough that most accounts have no history with it yet.
You run in markets where partner inventory is thin. Partner supply is not evenly distributed by country or vertical, so the same checkbox can mean very different volumes in two accounts. We are measuring the setting, not the exposure.
How to check yours in about three minutes
- Open any Search campaign, go to Settings, and expand Networks. Read the state of “Include Google search partners”.
- Do not stop there. Twenty four of the 42 scored accounts are internally uniform, which is a reason to expect the same answer across the account, not a reason to skip the check. Sort the full campaign list on the network column instead of opening campaigns one at a time.
- Before changing anything, segment your existing performance by network so you are deciding on evidence rather than on an article. Partner placement reporting has existed since August 2025 for Search, Shopping and App campaigns.
- If you decide to opt out, do it as one sweep across the account and note the date. Mixed settings inside one account are common in this data, and they make every later comparison harder to read.
Key takeaways
- Search partners are on by default, and Google says so in the help centre. Every campaign starts opted in.
- In this portfolio, 51.6% of 740 live Search campaigns still include them, and 50.7% with the largest account removed.
- The distribution is bimodal: 15 of 42 accounts at zero, 9 at one hundred, which is an account level pattern rather than a campaign-level one.
- Spend share is 62.0% pooled but 34.0% without the largest account, so use the equal account figure: a median of 21.6%.
- Display expansion, the other default on the same screen, is down to 3.9% of campaigns and 0.4% of spend.
Researcher’s take
I expected this to be a story about people ignoring a well covered problem, and the data politely declined. 24 of the 42 accounts sit at one end or the other, which is what an account wide state looks like, whoever or whatever produced it. What is missing is the middle. A portfolio where campaigns were judged one at a time on their own numbers would have a middle, and until August 2025 judging them that way was hard anyway, because partner level reporting did not exist. The uncomfortable version is that the sweep and the never touching it produce the same artefact in the data, and from the outside you cannot tell an informed opt out from a copied setup. That is why the useful move is not to change the box, it is to segment by network first and write down what you saw.
Igor Ivitskiy, Doctor Ads
Method
Data statement v.2026.09. Source: campaign settings and monthly campaign performance for a managed portfolio, one snapshot dated 10 July 2026. Unit of analysis is one Search campaign. The population is campaigns with campaign type Search that recorded more than zero cost in the twelve months from July 2025 to June 2026: 740 campaigns in 76 accounts, $4.05M of spend, all figures normalised to USD. Accounts are pseudonymised and no account, brand, vertical or campaign name is published.
Definition. The measured field is the campaign level network flag that the interface calls “Include Google search partners”, read as true or false. No inference is involved, and no attempt is made to estimate partner impressions, clicks or cost, which this export does not carry.
Weighting. Every headline is reported twice: pooled across campaigns, and as the median across accounts with at least three live campaigns (42 of the 76). Where the two diverge we print both, and where a pooled figure fails the leave one account out test we say so on the page rather than in a footnote. The spend share is the one number here that fails it: 62.0% pooled, 34.0% without the largest account, median account 21.6%.
Selection note. This is an agency-managed portfolio, not a random sample of advertisers. We did not measure the direction of that selection: professional management could correlate with deliberate exclusion of the network or with deliberate inclusion, and nothing here settles which.
Limitations. Four, all stated in the body. The setting is a snapshot taken on 10 July 2026 while the spend window runs backwards from that date, so a campaign changed in April is counted in its current state. A network flag records eligibility, not delivery, and says nothing about how much partner traffic a campaign actually served. Partner placement reporting only became available in August 2025, so no account in this data has a long history of being able to judge the setting on its own numbers. And this is Search campaigns only, so nothing here transfers to Performance Max, Shopping or app campaigns.
Changelog. First published September 2026. Recomputed quarterly against the live claim registry.
What to read next
- How much of a Google Ads budget actually goes nowhere, the wider measurement this setting sits inside.
- Where wasted spend concentrates, if you are deciding what to look at first.
- The unnamed row in the search categories report, another case of a reporting gap shaping what advertisers believe.
- The wider wasted spend file.


