

TL;DR abstract. Every competent audit already tells you to read Search lost impression share (rank) before you raise a budget. What nobody has published is how often that advice turns out to be the binding one. Google splits the impressions you never received into two named causes: time lost because the daily budget ran dry, and time lost because your ad was not competitive enough in the auction. We measured the split across 7,977 Search campaign-months in the managed portfolio.
Of all the impression share that went missing, rank held 83.7% weighted by spend and 79.3% when the percentages are pooled without spend weights. Budget was the larger of the two causes in only 14.7% of campaign-months. At account level the median account owed 73.4% of its lost impression share to rank, middle half 58.9% to 86.5%. One caveat belongs up here rather than in a footnote: this is a professionally managed portfolio carrying $4.88M between January 2024 and July 2026, so budgets are set with more care than average and the budget column is probably smaller here than an unmanaged advertiser should expect. That makes the finding conservative on budget rather than a market benchmark. Google also caps these percentages at the top and the bottom of their range, which makes the true gap look smaller than it is rather than larger.
The reflex is to add budget, because budget is the one lever an owner can pull alone, today, without asking anyone. The word “Limited” shows up beside a campaign, it reads as a money problem, and the money goes in. Then impression share barely moves and nobody can say why.
Google does tell you why, in two columns most accounts never switch on. Search lost impression share (budget) is, in Google’s own words, “the percentage of time that your ads weren’t shown on the Search Network due to insufficient budget.” Search lost impression share (rank) is “the percentage of time that your ads weren’t shown on the Search Network due to poor Ad Rank in the auction.” The advice to compare them is fifteen years old. What was missing is the measurement of how that comparison usually lands, so we pulled both columns for every Search campaign-month in a managed portfolio. The auction side of the same bill is where we found earlier that half the rivals in a typical auction never show a numeric share.
Of everything lost, rank held roughly four fifths
Take all the impression share that went missing in the window and ask what share of it each cause owns. Weighted by spend, rank holds 83.7%. Pool the same percentages without spend weights and rank still holds 79.3%. When the weighted and unweighted views land within a few points of each other, the result is not being carried by one big spender.
The head-to-head is blunter. In only 14.7% of Search campaign-months did budget cost more time than rank did. Roughly six campaign-months in seven, the money was not the binding constraint.
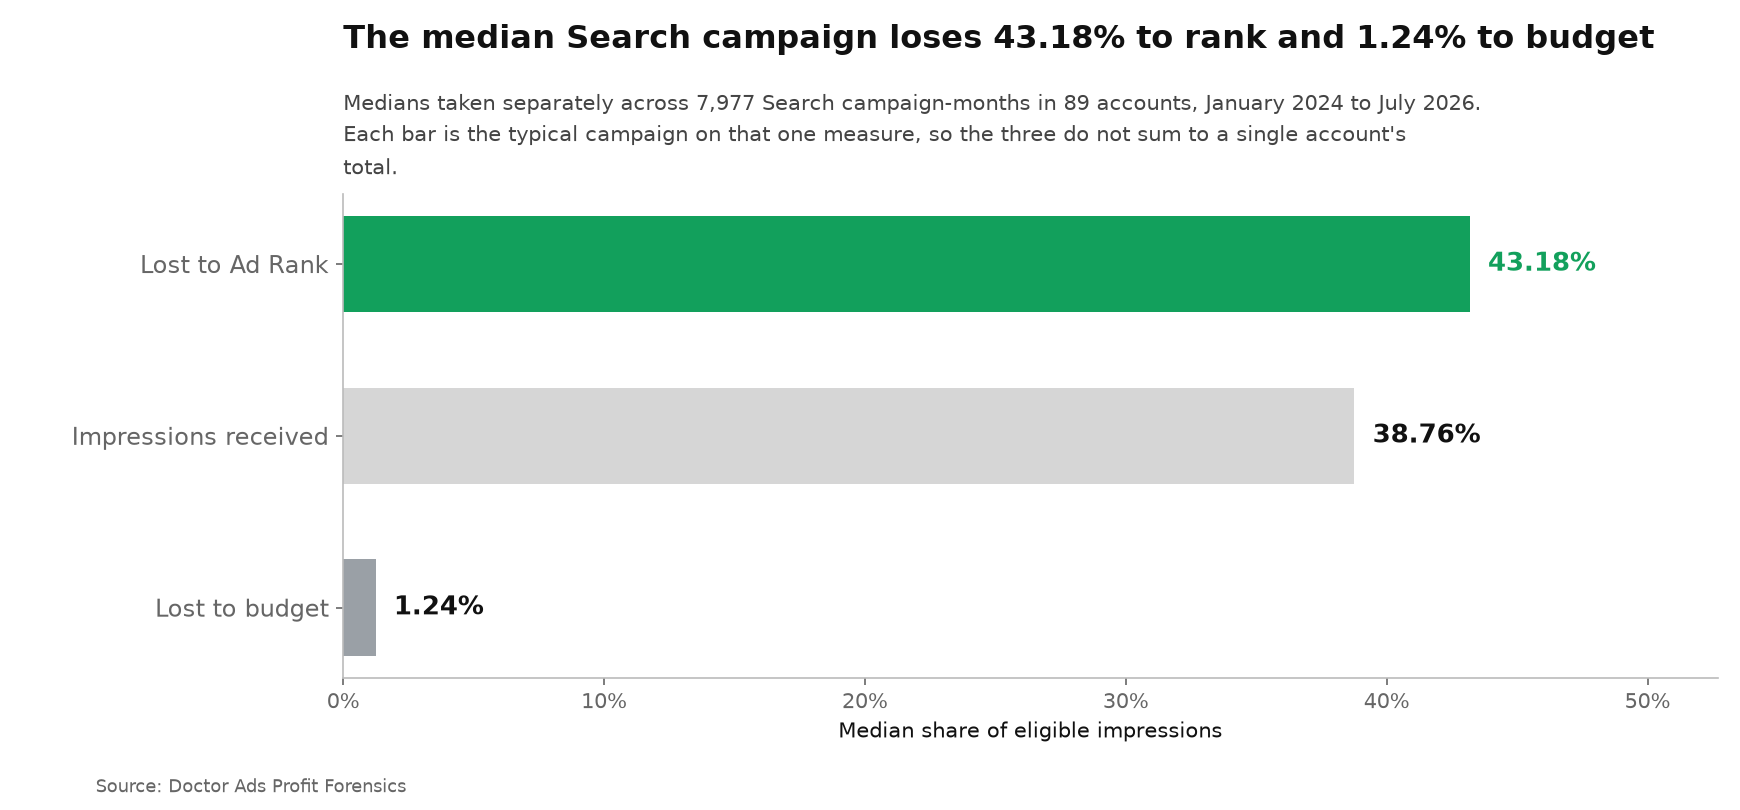
The levels tell the same story from a different angle. In the median campaign-month, budget accounts for 1.24% of eligible time and rank for 43.18%. Those are two separate medians, not one campaign measured against itself, and they do not add up with the 38.76% impression share the median campaign actually received. Read the levels as two typical readings and read the 83.7% as the head-to-head.
The wall is the daily cap, and your bid is on the other side of it
There is a nineteenth-century farming law that helps here, as long as you hold it carefully. Liebig’s Law of the Minimum says a crop grows only as far as its scarcest nutrient allows. Pour on all the nitrogen you like: if the soil is short of phosphorus, the yield stops where the phosphorus stops.
The Rank Wall is the point where raising the daily cap stops buying impressions because the binding constraint is Ad Rank instead. Here the metaphor needs a correction most articles skip: Ad Rank is not money-free. Google says Ad Rank thresholds are “determined by your ad quality and are adjusted based on various factors, including ad position, the topic and nature of the search, and user signals and attributes such as location and device type,” and that the calculation “incorporates your bid and auction-time quality” including expected click-through rate, ad relevance and landing page experience. Your bid sits inside the rank stave. Only the daily cap is the other one. More cap will not win auctions you are losing on rank. A higher bid might, and it costs money too.
That is why the diagnosis matters more than the reflex. The two columns do not tell you to spend or to stop spending. They tell you which spending decision is even connected to the problem.
The spend groups, with their real sizes attached
We split the accounts into three equal groups by total spend inside the window and looked at the typical account in each. The sizes matter, because these are lifetime figures across roughly thirty months and not monthly ones.
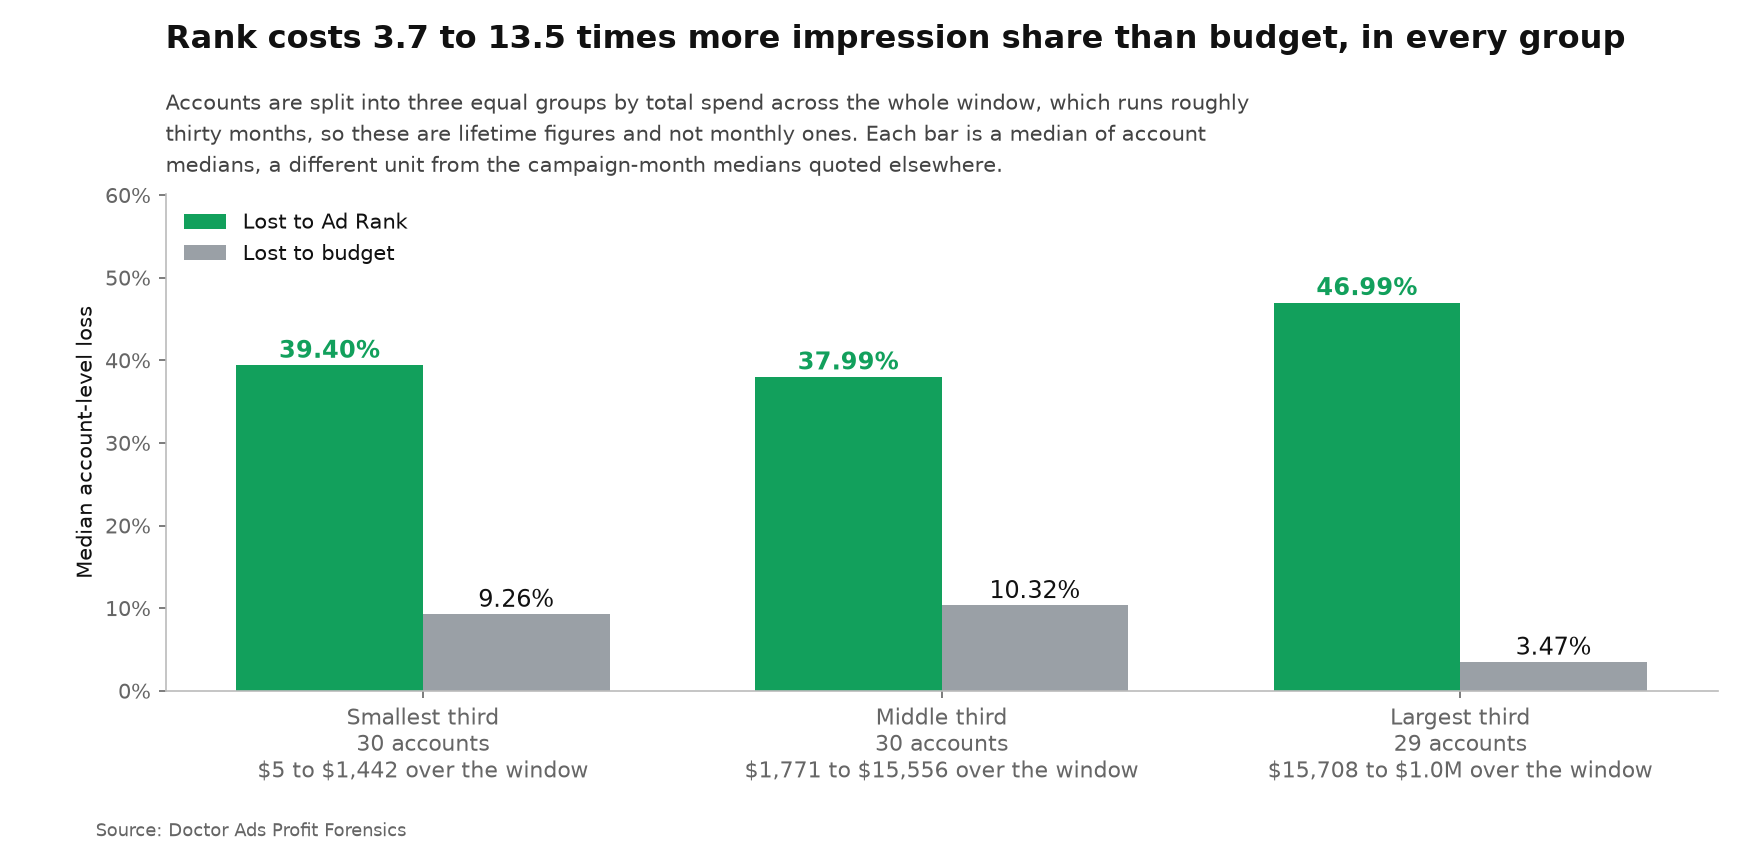
The lowest third spent between $5 and $1,442 across the entire window, a median of $501, which is small change per month. The middle third ran from $1,771 to $15,556, median $5,787. The top third starts at $15,708 and reaches just over a million. An advertiser spending $2,000 a month sits in the top third of this portfolio, not the bottom.
With the sizes attached, the pattern reads honestly. Budget-loss levels are 9.26% and 10.32% in the two lower thirds, slightly higher in the middle third than in the smallest one, and both are real enough to act on. In the top third budget-loss falls to 3.47% while rank-loss climbs to 46.99%. In every group rank-loss is the larger number by a wide margin. Scale does not solve the auction. It just removes the excuse.
The number that survives losing any account
A portfolio finding is only worth quoting if it is not one loud account in a costume. So we aggregated inside each account first, then took the median of the account-level results: 73.4% of lost impression share owed to rank, with the middle half of accounts running from 58.9% to 86.5%.
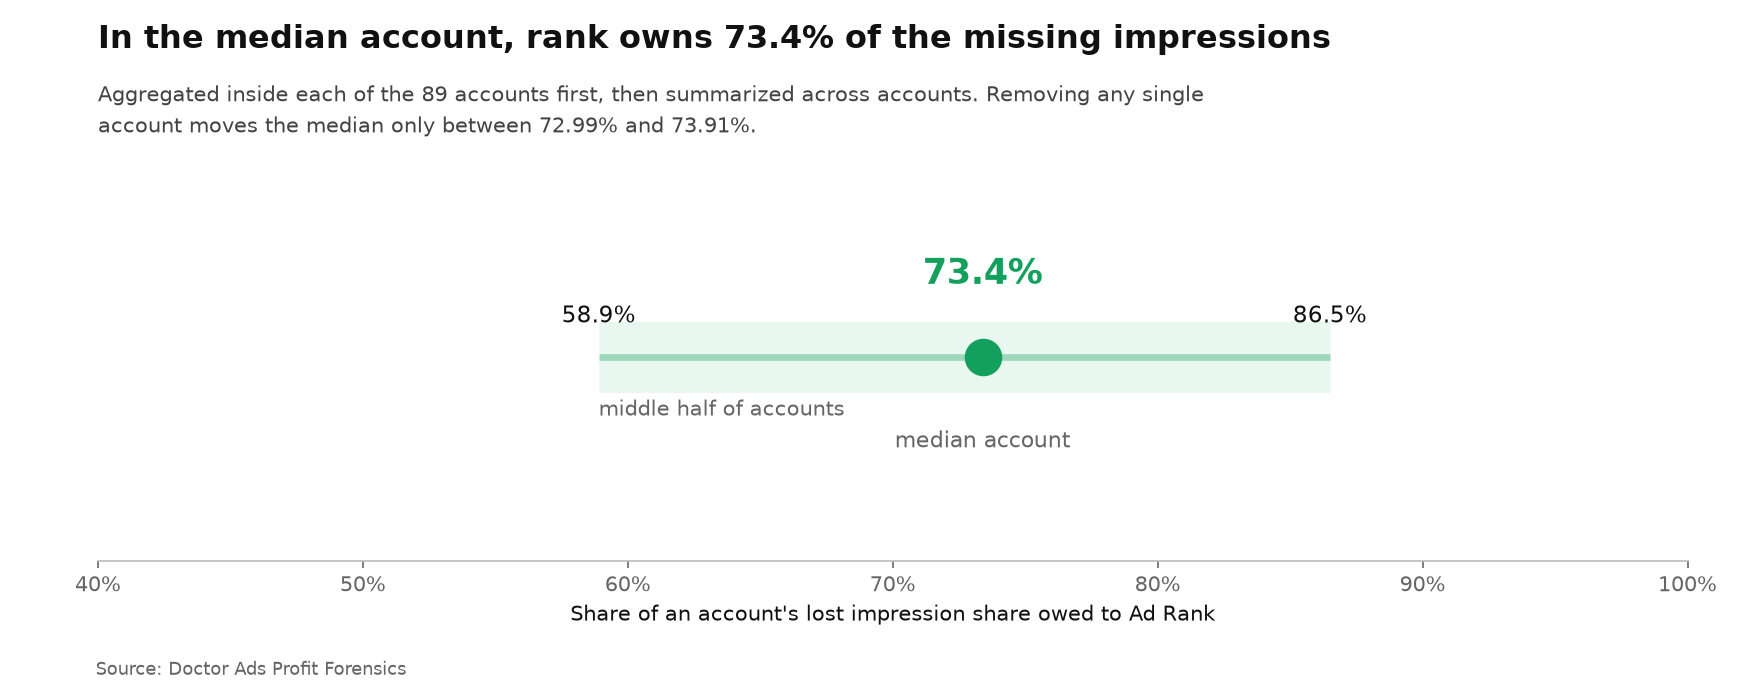
Then we removed each account in turn and recalculated, for every account. The answer moved between 72.99% and 73.91%. No single account is holding this result up.
What to do on Monday morning
- Add both columns before you approve anything. In the campaigns view, add Search lost IS (budget) and Search lost IS (rank). You are comparing them with each other, not against a target value.
- Rank larger and the campaign underspending its cap: stop adding budget. Unspent budget on a rank-limited campaign is the clearest sign that the cap is not the wall. The levers that touch rank are the bid, or the target you give the bid strategy, plus relevance, landing page experience and asset coverage.
- Rank larger and the campaign spending to its cap: you are hitting both walls. Extra budget here buys more auctions that you then lose on rank, which is the expensive version of the same mistake. Work rank first, then reopen the cap.
- Budget larger: check whether the campaign has earned the money. A campaign genuinely capped by budget deserves funding only if what it already bought was profitable, and in most accounts a measurable share of the current spend is not.
- Recheck monthly. The two causes trade places as competitors, seasons and your own quality change.
The researcher’s take
I understand the reflex completely. Budget is fast, private and entirely under your control. Rank is slow, involves other people, and starts with admitting the ad might be the weak part. So the money goes in, impression share does not move, and the account quietly concludes the platform is broken. It is not broken. It is reporting two causes in two columns and leaving both switched off by default. The part I would push back on, in myself as much as in anyone, is the comfortable version of this finding: rank is not free advice, because your bid lives inside it. What the data says is narrower and more useful than “stop spending”. It says the daily cap is almost never where your missing impressions went.
Method and data statement
Doctor Ads Profit Forensics is the research desk of a Google Ads practice with 19 years and $770M managed spend behind it.
Source: one snapshot of an agency management account, exported through a read-only API window on July 10, 2026. Accounts are pseudonymous and all currency is normalized to US dollars. The unit of observation is a campaign-month. We kept rows where the campaign type is Search, both lost impression share measures are present and spend is above zero, from January 2024 through July 2026: 7,977 campaign-months in 89 accounts carrying $4,875,080. The head-to-head share was computed as rank divided by rank plus budget, both spend-weighted (83.7%) and pooled without spend weights (79.3%); the mean of row-level shares is a third figure, 81.4%, and is not the one quoted. Levels are reported as separate medians on each measure and are not a ratio of one another. Account-level results aggregate inside the account first; that median was recalculated 89 times, each time omitting one account, and stayed within 72.99% to 73.91%. Spend groups are terciles of total account spend in the window, reported as medians of account medians, with the group boundaries stated in the text. To reproduce this, export campaign-level Search lost IS (budget), Search lost IS (rank), impression share and cost by month for each account, apply the same filter, and compare the two loss columns row by row before aggregating. These figures come from this agency snapshot and are not the same population as the $133M corpus used in our other studies.
Limitations
- Censored source values. Google returns these percentages truncated: anything below 0.1 arrives as 0.0999 and anything above 0.9 arrives as 0.9001. In this window 6.4% of rows were truncated on rank and 0.8% on budget, which compresses the gap we report rather than inflating it.
- Managed portfolio, so the budget column is flattered. These accounts are under professional management, where budgets are set deliberately. An unmanaged advertiser should expect a larger budget column than the one measured here.
- Percentage of time, not of impressions. Google defines both loss columns as a percentage of time, while impression share is impressions over eligible impressions. The industry treats the three as adding to 100%. We report each on Google’s own wording.
- Observed accounts, not an experiment. Nothing here estimates what happens if you change a bid, a budget or an ad. It describes where the missing impression share sat.
- Search only. Performance Max, Shopping and Display campaigns report impression share differently or not at all, and are excluded. What those campaign types do report is a category summary that leaves a median 44.0% of clicks unnamed.
- Three units on one page. Campaign-month levels, the head-to-head share of lost impression share, and account-level medians are three different things. Each is labelled where it appears and none is interchangeable with another.
Key Takeaways
- Rank held 83.7% of all lost impression share weighted by spend and 79.3% pooled without weights. That is the honest head-to-head between the two causes.
- Budget was the larger cause in only 14.7% of campaign-months. The budget story is the exception, not the rule.
- The median account owed 73.4% of its lost impression share to rank, middle half 58.9% to 86.5%. Removing any single account moves that by less than one point.
- Levels in the median campaign-month were 43.18% rank and 1.24% budget. Two separate medians, not a within-campaign ratio.
- Your bid lives inside rank, and only the daily cap is the other stave. “Stop adding budget” is right for the cap and wrong for the bid.
When this does not apply
A brand-new campaign in its first weeks. Early data is thin and both columns are unstable. Give it a month of real delivery before reading them as a diagnosis.
Deliberately capped campaigns. If you set a low daily budget on purpose, to hold a test at a fixed size, a high budget-loss figure is the setting working rather than a fault.
Unmanaged accounts with basic setup problems. A small account with a runaway broad-match term can genuinely exhaust its budget every morning. The check still applies. The ratio measured here almost certainly does not.
This analysis describes observed portfolio data and does not guarantee the same result in another account.
