

TL;DR abstract. Every audience list in your Google Ads account feels like an asset: a named group of people you can show ads to, exclude or watch. In the median account we examined, 66.7% of all exported lists showed a size of zero on both Search and Display. We call it The Empty List Majority. A zero is Google’s count of recently active members, not proof that a list is broken. Still, a list Google cannot count is a label, not an audience.
To audit audience targeting, work in order. Read each audience’s mode first: Targeting restricts who can see an ad, while Observation only reports on people who see it anyway. Then check the size of every list your campaigns use, and learn what your Observation report is made of. In a separate set of Search audit exports, Google’s broad affinity segments held about two thirds of the observed cost in the median account, in-market segments came next, and customer lists held about 0.02%. Demographics, geography, hours and devices come last.
The lists come from a snapshot of the Doctor Ads managed portfolio, the Observation figures from earlier audit exports. Neither shows wasted spend or broken delivery. Both show where an audit should start: with what your lists and reports contain, before anyone changes who can see your ads.
The closest published example we found covers one account. In Search Engine Journal on 30 July 2025, Brooke Osmundson described a brand Search campaign whose customer lists had moved from Targeting to Observation. Three months later, 89% of its conversions came from people outside those lists. That is one client and one campaign. This hub asks a related question across a managed portfolio: how much work do your lists actually do?
Observation watches, Targeting fences: read the mode first
Before you judge any audience, find out what it is allowed to do. In a Search campaign, an audience set to Targeting is a fence: only people in the segment can see the ad, within the campaign’s other settings. An audience set to Observation is a label: everyone eligible can still see the ad, and the report tags the people who happen to be in the segment. Google’s Targeting and Observation documentation draws exactly that line.
Most confusion in an audience audit starts here. A segment called “past buyers” sounds like a boundary even when it is only a label on a report. Ask whoever runs the account to describe the intended buyer in one sentence, then compare that sentence with the setting.
Write down exclusions as well. A list used to keep existing customers out does a different job from the same list used to watch them, and its name will not tell you which. Smart Bidding adds a third job: the same Google page says first-party segments added in Observation are used as signals for bidding.
Performance Max reads audiences differently. Google describes audience signals as suggestions, and relevant users outside them can still see ads. The Search figures on this page do not audit Performance Max delivery, so check the campaign type before deciding what an audience field promises.
The output of this step is one word per audience: fence, exclusion, signal or label. If the team cannot say which, no performance chart will settle it. Observation watches. Targeting fences.
The Empty List Majority: two lists in three show zero
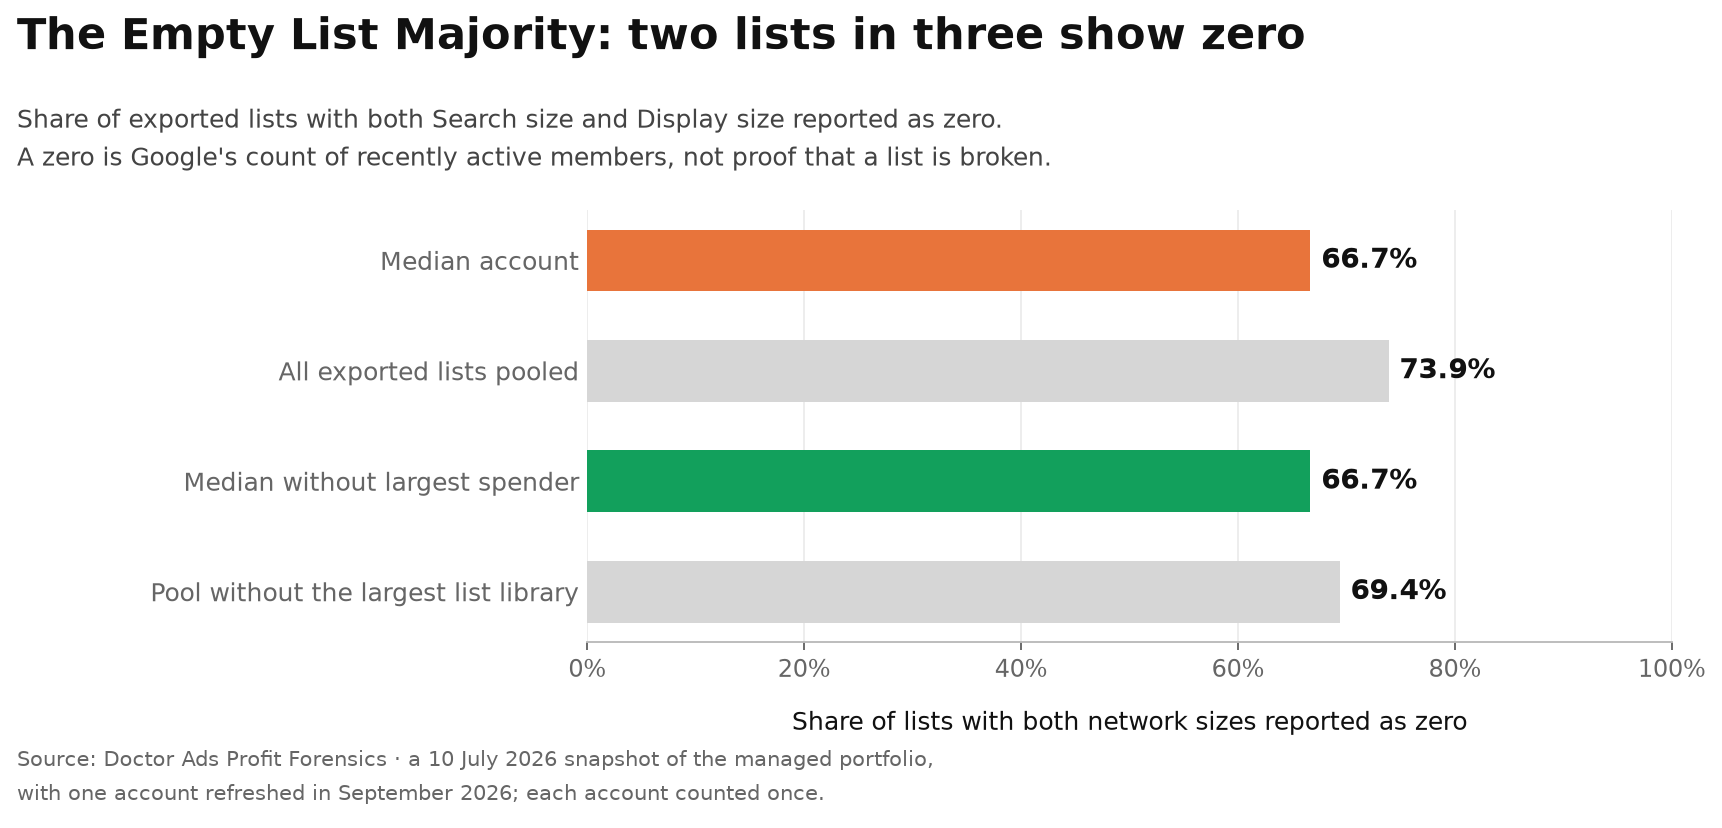
Now open the lists themselves. In the median account, 66.7% of every exported audience list showed a size of zero on both Search and Display. Counting all the accounts’ lists together, the share was 73.9%. A library can look long and busy while, in the typical account, Google counts no one in two lists out of three.
That is The Empty List Majority. There is an old line for it: the map is not the territory. Your list library is the map, and the size columns are the territory.
Why should an owner care about a column of zeros? Because of what lists are for. A zero list used as a fence lets no one through. Used as an exclusion, it keeps no one out. A reported zero alone does not show whether the list gives Smart Bidding a useful signal.
What a zero actually means
A zero is Google’s count, not a verdict on the list. Google sizes a list separately for each network. Search size, for example, is based on members who searched on Google in the previous 30 days, according to Google’s Search help on data segments. So a list can hold people and still show zero on Search.
The count matters because Google uses it as a gate. A list needs at least 100 active users in the last 30 days to serve on Search, Display or YouTube, according to Google’s explanation of data segments. Google cut the Search minimum from 1,000 to 100 in December 2025, as Search Engine Roundtable reported. One exception catches older accounts: a customer list not uploaded or refreshed since 1 February 2024 still has to meet the old 1,000-user minimum.
Put the two together. A list showing zero on both networks was, on the day of the snapshot, below Google’s minimum on both. Whether that costs you anything turns on one question our data cannot answer and you can: does any campaign rely on that list?
Our export cannot say why a list shows zero. It leaves the list type blank and records no status, so it cannot separate customer lists from website lists, or a list with a broken source from a list nobody uses.
The two thirds is not one account’s quirk
Remove any single account and the median stays at 66.7%. The pooled share sits higher because the pool counts every list once, so big libraries weigh more. The biggest library holds about one list in six in the whole snapshot, and 96.8% of its own lists show zero. Take that account out and the pool is still about seven in ten: 69.4%.
The median gives every account one vote and describes the typical account; the pool gives every list one vote and describes the inventory. Both point the same way: in these accounts, zero is the common state of a list, not the exception.
What to do with a zero
Start from the campaigns, not the library. For each important campaign, write down the audiences it uses as a fence, an exclusion, a signal or a label. Then open each one in Audience Manager and read its source, definition, status and size on each network.
Anything under 100 on a network is below Google’s minimum there. For a list that matters, check whether the intended people can enter it and whether the right account receives it. Refresh an old customer upload. A new list may only need time to fill, while a list built on the wrong condition needs rebuilding.
Leave the rest of the library alone until you know what depends on it. Deleting every zero can remove a list someone still expects to use. The goal is not a tidy library; it is knowing which lists are doing work.
What the Observation report is made of: mostly affinity
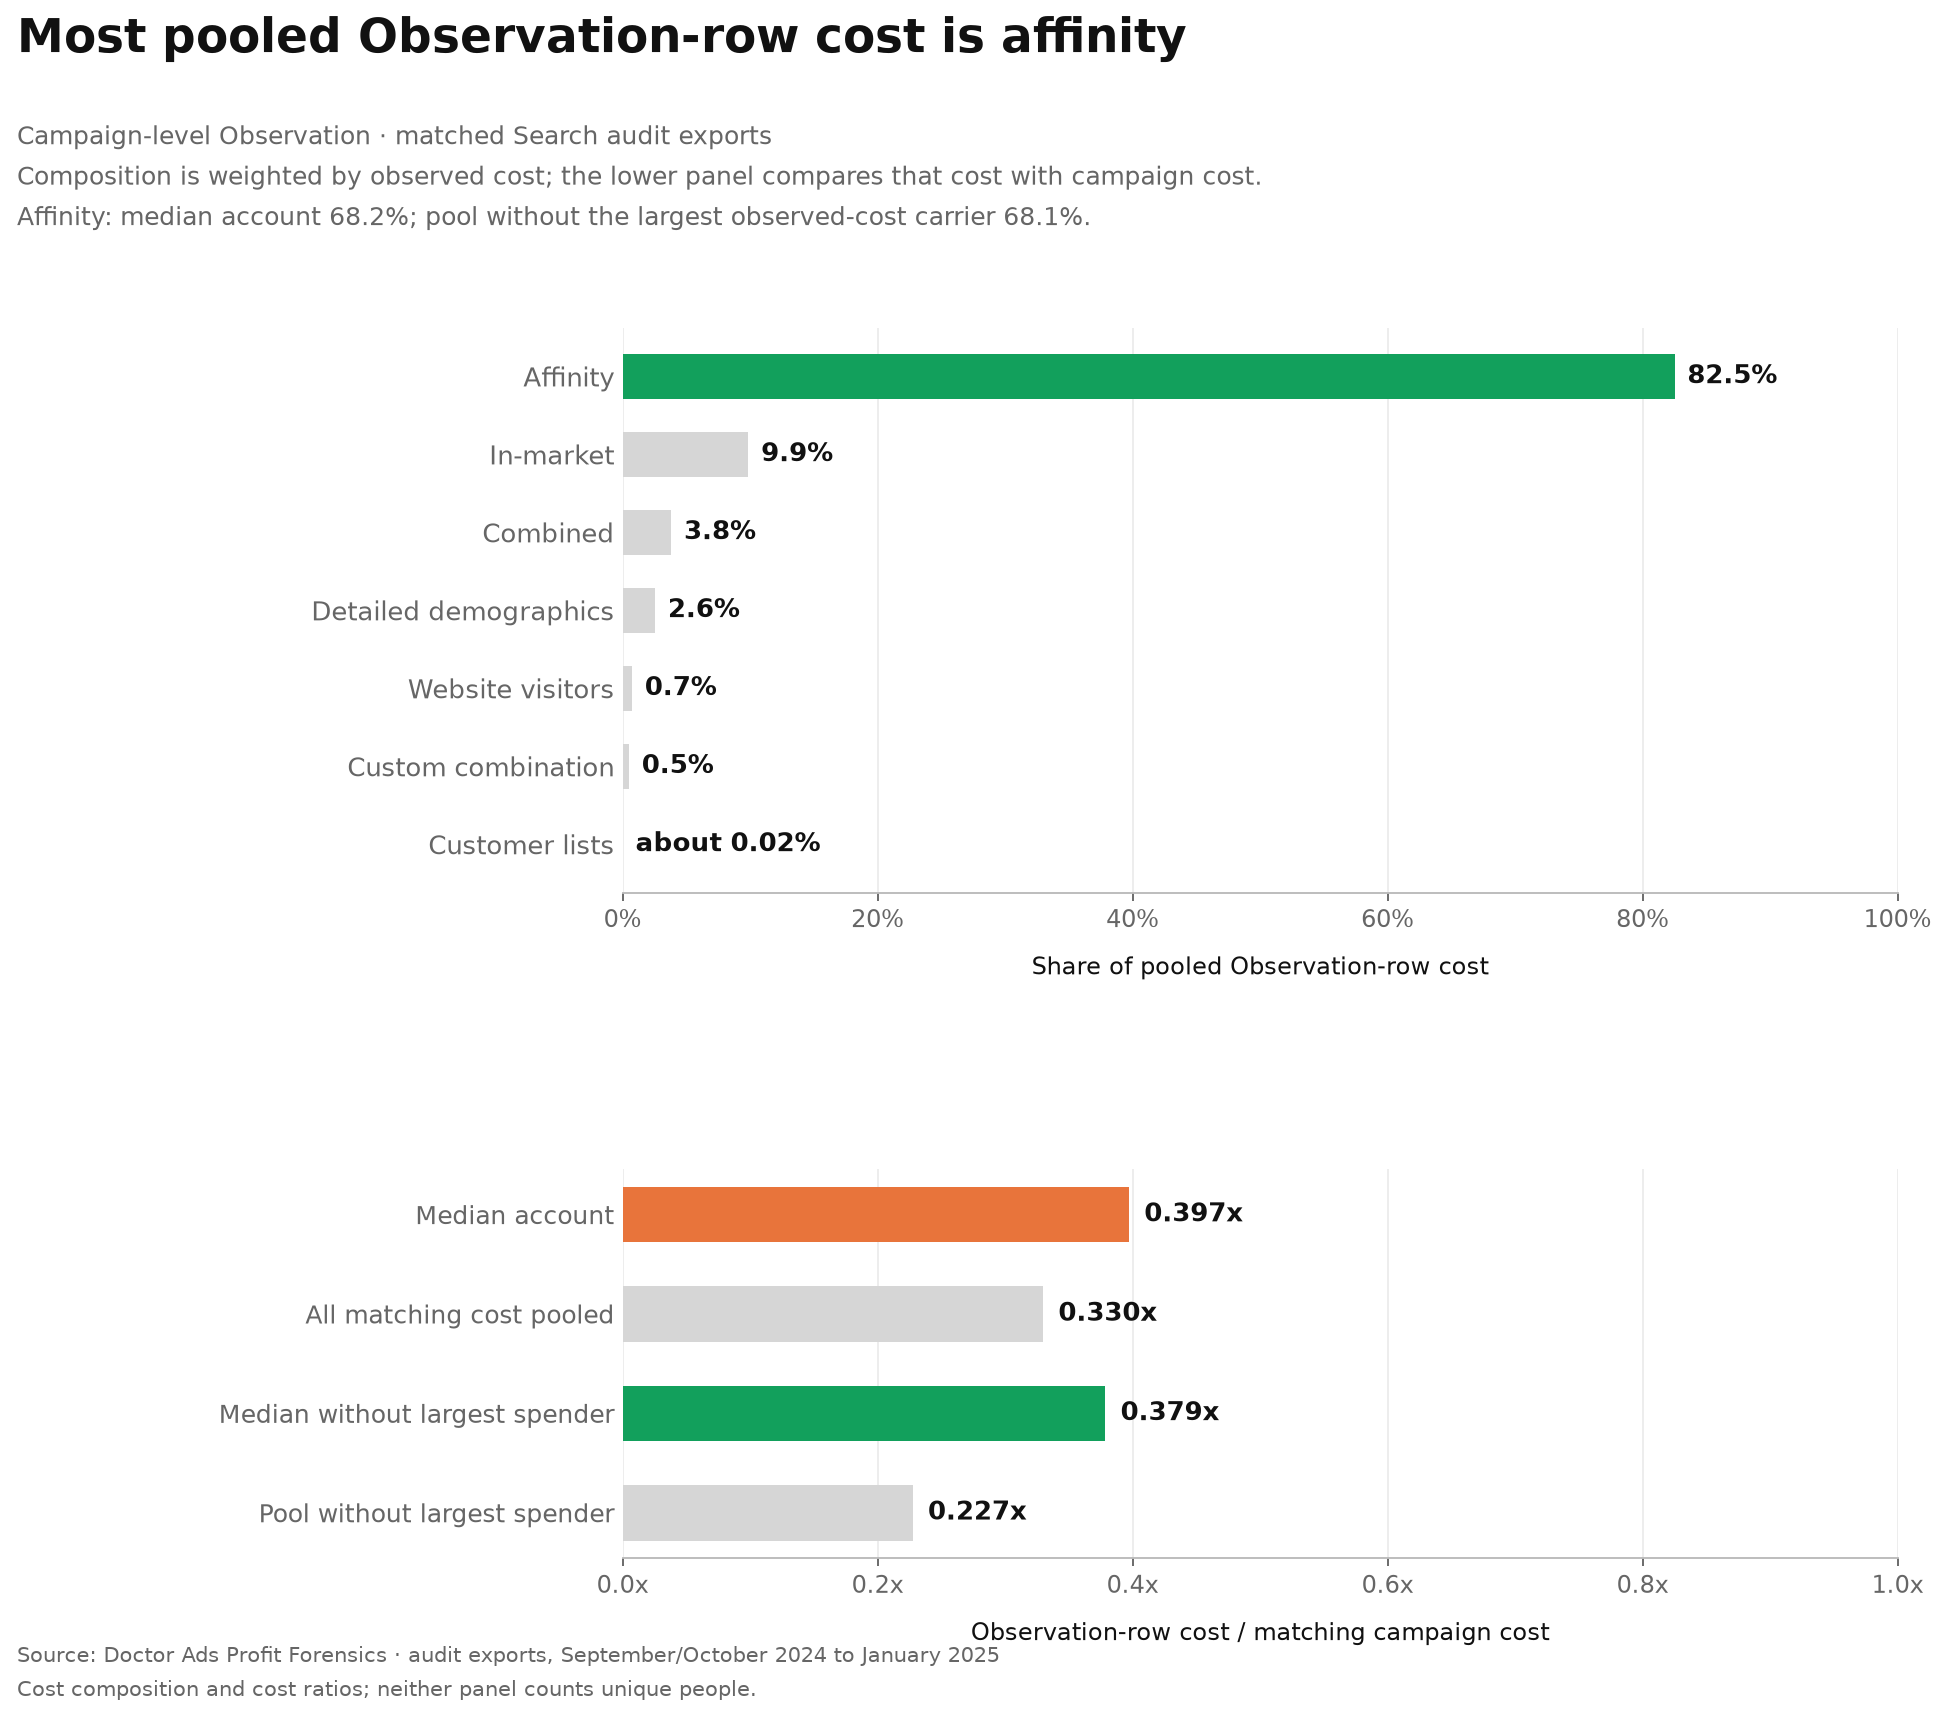
Next, read the Observation report for what it is. Its rows look like a picture of who your budget reached: one segment per line, cost beside it. We measured a separate, smaller set of Search audit exports, dated September or October 2024 to January 2025. In the median account, about two thirds of the cost on campaign-level Observation rows sat in affinity segments, the broad interest groups Google defines, not lists you build. Pooled across all the exports the share reaches about four fifths, because one account carried about half of all observed cost and was almost entirely affinity.
In-market segments, groups Google identifies as actively researching a purchase, carried about a tenth. Website-visitor lists, your remarketing, carried under 1%. Customer lists carried about 0.02%.
The segments built from your own customers were almost absent from the report built to show you audiences. If you judge your customer lists by this report, you are judging them on almost no money.
Why the account figure and the campaign figure differ
How much of a campaign’s cost the rows represent depends on how you count. For the median campaign, observed rows added up to about 4% of its cost. For the median account, they added up to about 40%. Both numbers are right, and the difference is the lesson.
Most campaigns carry little observed cost: nearly six in ten had less than 5% of their cost in observed rows. A minority carries a lot: a quarter of the campaigns, holding about half of the matched spend, had 30% or more. The account figure weights campaigns by spend, so those large, heavily observed campaigns set it. Affinity stays the majority of observed cost in the median account and whichever single account is left out, so most of what those campaigns observe is affinity.
So never apply the account figure to a single campaign. Account ratios ran from about 2% to about two thirds, so there is no normal level to aim for. A high share is not a score, and a low one does not mean anything is missing.
The rows never add up to more than the bill
In no campaign did the observed rows sum past the campaign’s own cost. That is what you would expect if each paid click is credited to a single segment. Google documents a one-segment rule for your data segments: when a Search user belongs to more than one, “the segment with highest bid adjustment receives the impression attribution,” in the words of its Search help on data segments.
Google states that rule for data segments, meaning your website-visitor and customer lists. We did not find it stated for affinity or in-market rows, so the fit is consistent, not proven. Either way, the rows describe labelled traffic, not unique people: one person can belong to several segments, as Google’s Search audience and automated-bidding documentation notes.
How to read the report instead
Treat the Observation report as a sample of labelled traffic, not a map of your budget. Before comparing rows, match their campaigns, reporting level and dates to the campaign totals. Google’s audience reporting page offers account, campaign and ad-group views, and adding an ad-group view to a campaign view of the same activity can count the same cost twice.
Then resist two tempting moves. Do not add the rows up to measure how much of your spend “the audiences” explain. And do not move an attractive row from Observation to Targeting expecting to buy more of those people: in Search, Targeting adds no one; it removes everyone outside the segment.
A segment row that converts cheaply is a hypothesis for a test, not proof that you should reach more people like it.
Demographics: almost three dollars in ten have no known age
Before you exclude anyone by age, look at the row nobody can label. In our published age study, Unknown took a median 28.8% of account spend. Excluding it is not trimming a corner. It is a decision about almost three dollars in ten, and the analysis of Google Ads age targeting and Unknown age shows what that decision trades away.
Google’s demographic targeting documentation defines Unknown as people whose attributes it has not identified. That label says nothing about whether a person can buy. Compare the Unknown row with the known ages on the same outcome, and if your conversion is an enquiry, check how many enquiries become customers first.
Check the important campaigns one at a time as well. A group that looks expensive at account level may simply receive a different mix of campaigns, products and goals.
Gender barely moved the cost of a conversion
The other common reflex is gender. Our gender and household-income study found a median women-to-men conversion-cost ratio of 0.99 inside the same account. That is close to parity. A persona that says “our buyer is a woman” is not, on its own, a reason to bid differently.
A product with a narrow buyer may still show a real gap, so read your own ratio. Then check what your bidding can use. Google’s bid-adjustment documentation says ordinary manual demographic adjustments are not supported by Smart Bidding. If you bid manually, a modifier is an available test; under Smart Bidding, an exclusion narrows reach, so run it as an experiment before you keep it.
Geography: the setting and the report answer different questions
Read geography twice: once as the instruction you gave, once as the record of where the money went. Our location study found a median 2.55% of classified geographic spend in rows labelled area of interest. In the typical account that is a thin slice, and the presence-versus-interest analysis explains why those rows cannot reveal the campaign’s setting on their own.
The label is Google’s inference about location or interest, not confirmation of where a person stood. So inspect the campaign’s advanced location options separately, then ask the business question: can people interested in your location become customers? If customers travel to you, researching the destination from elsewhere may be part of buying. If you can only serve people already nearby, that is a different constraint.
Compare the price and the eventual business outcome of those rows before you change the rule. A cheaper click is not necessarily a cheaper customer, and a dearer one is not necessarily waste. This is the audit’s lesson in a third form: the setting is the instruction, and the report is what happened after it.
Hours and devices: check the clock and the phone
Finish with when the campaign may run and where its money lands. These two checks connect targeting to what people experience after the click.
A schedule can exist without narrowing the week
Our scheduling study found that 16.3% of campaigns spending in the first half of 2026 carried restrictive hours at the later snapshot. Most spending campaigns, in other words, could run at any hour. The audit of ad-schedule adoption separates having schedule rows from actually leaving hours uncovered.
Look at the hours the rows cover, not at whether a schedule exists. An empty schedule and a full-week schedule reach the same hours, even though they look different in an inventory. Then compare eligibility with your ability to respond: if enquiries wait unanswered overnight, check what happens to them before blaming the hour of the click.
Smart Bidding still respects an ad schedule, though routine hourly bid modifiers are not supported, according to the bid-adjustment documentation linked above. So restricting hours removes auctions outright; it does not ask the bidding to value an hour differently.
Mobile takes most of the money, so test the phone
Our device study found that the median account put 78.9% of its spend on mobile in the first half of 2026. The analysis of mobile share of Google Ads spend gives the context for reading your own device mix. It is a share of spend, not a count of mobile customers or a recommended split.
Open your landing page on a phone and complete the important action yourself: the form, the payment or the enquiry. That test can reveal a problem worth fixing with no audience change at all. Device controls depend on the strategy and campaign type. Google’s support table lists exceptions, including device target adjustments for Target CPA and some device exclusions, so verify the control before proposing a blanket device bid cut.
The audit on one page, with each check’s own denominator
The numbers below are signposts, not a combined score. Each answers a different question, and list counts, cost shares, ratios and settings cannot be added into one picture of an audience.
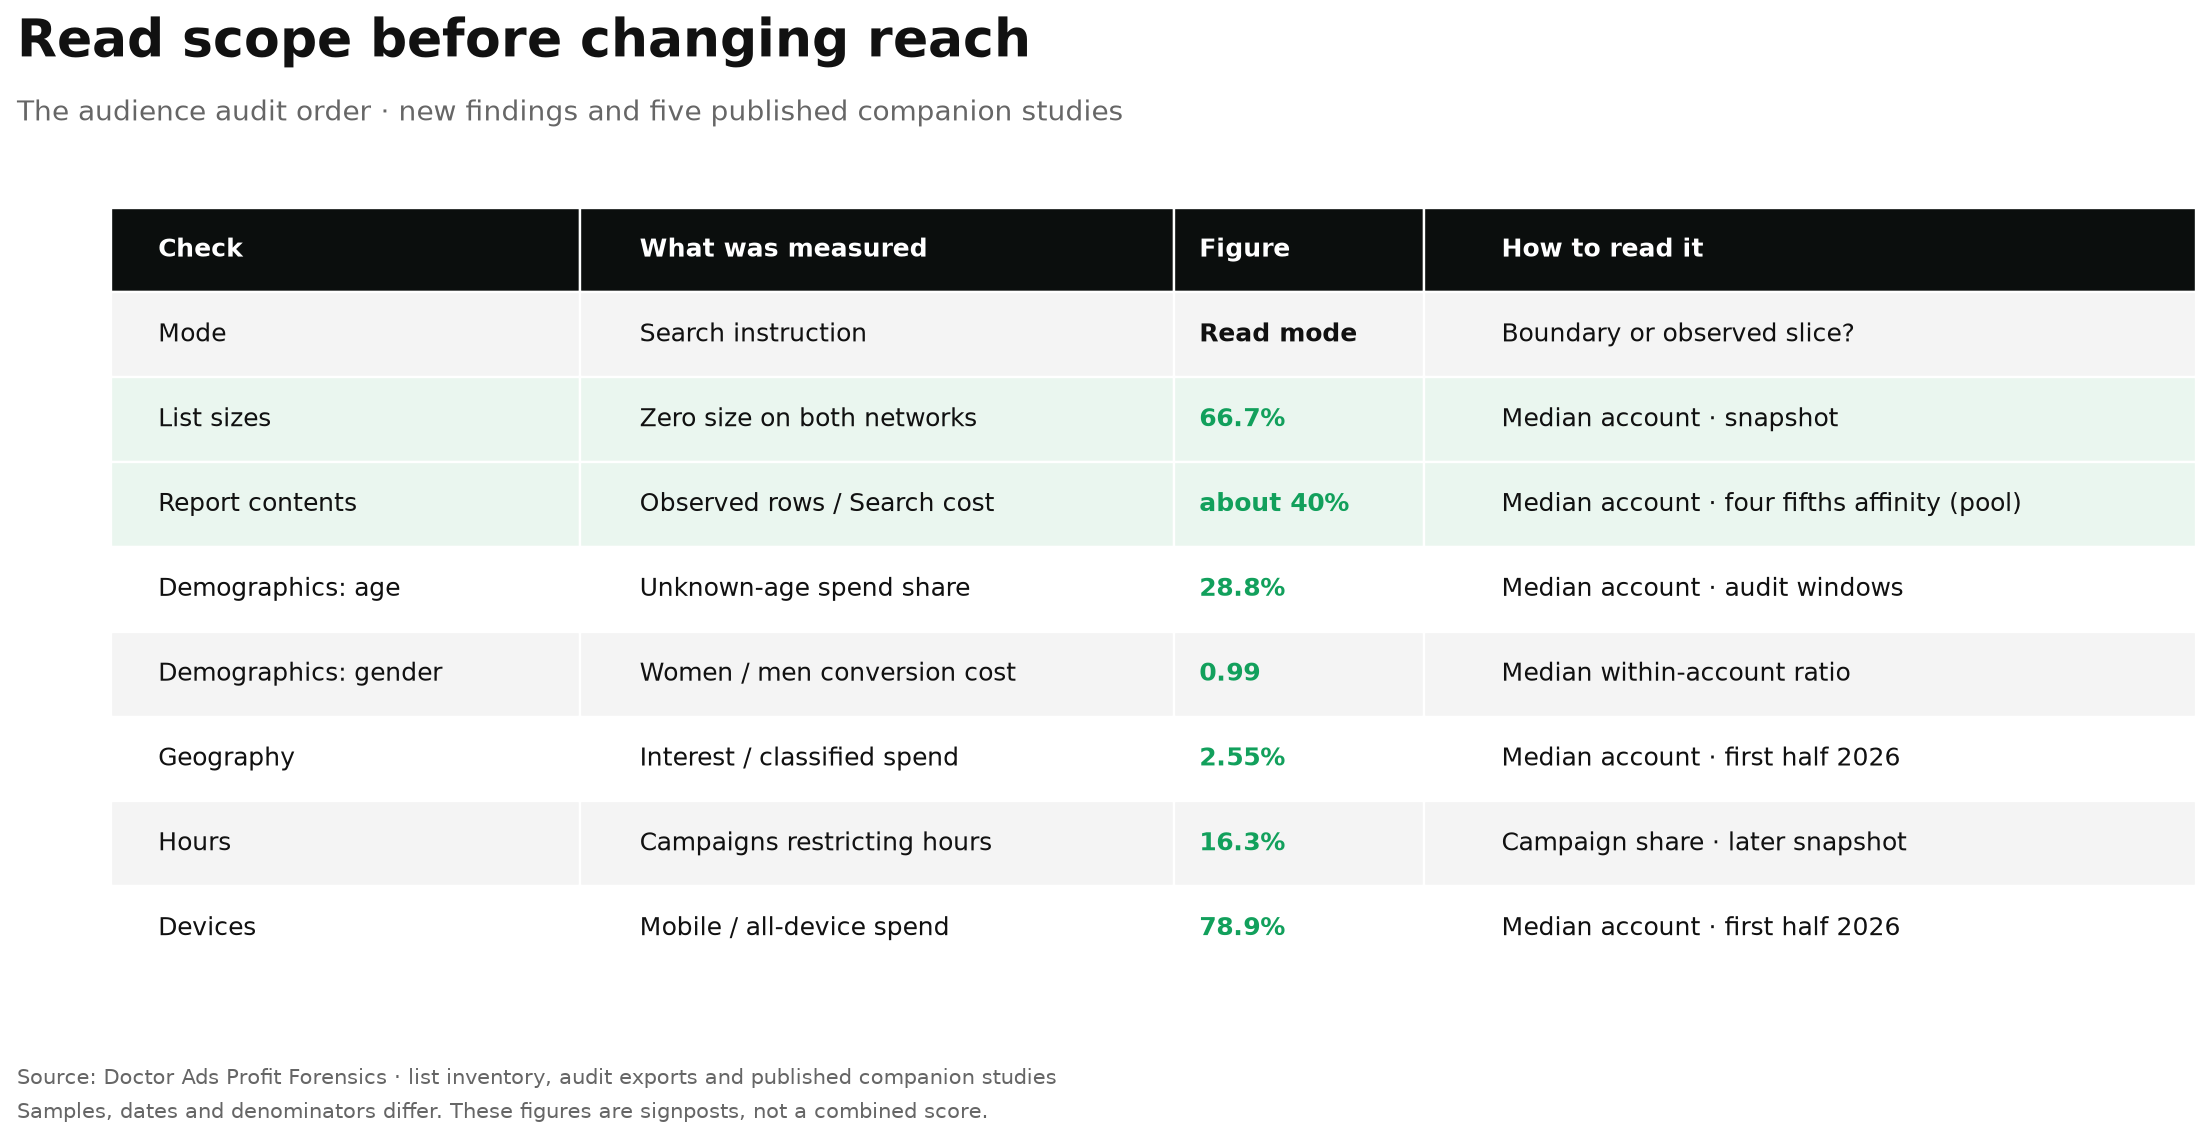
| Check | What was measured | Result | Decision it informs |
|---|---|---|---|
| Mode | Search audience setting | Read Targeting or Observation | Is this audience a fence or a label? |
| List sizes | Lists with zero size on both networks | 66.7% of all exported lists, median account | Which of the lists my campaigns use sit under 100 on a network? |
| Report contents | Observation-row cost / matching Search campaign cost | About 40% in the median account; about two thirds of observed cost is affinity in the median account | Mostly Google’s interest categories: read it as labelled traffic, not a budget map |
| Age | Unknown-age share of spend | 28.8% median account | How much reach would an exclusion put at stake? |
| Gender | Women / men conversion cost within account | 0.99 median ratio | Does a demographic test have a useful premise? |
| Geography | Interest share of classified geographic spend | 2.55% median account | Can those users become your customers? |
| Hours | Spending campaigns with restrictive schedules | 16.3% of campaigns | Were the eligible hours chosen on purpose? |
| Devices | Mobile share of all-device spend | 78.9% median account | Does the buying experience suit where the money goes? |
When this does not apply
You need a Performance Max reach diagnosis. Its audience signals do a different job from Search Observation rows, so use the campaign’s own diagnostics; the Search figures here cannot show its delivery.
Your important lists were just created or changed. A new list needs time to fill, and a snapshot zero may already be out of date. Read the current size and status before treating a zero as persistent.
Your customer list is old. A customer list not uploaded or refreshed since 1 February 2024 is still held to the old 1,000-user minimum. It can sit well above zero and still be too small to serve, so judge it against that bar, not against 100.
You sell to a deliberately narrow buyer group. A justified boundary can matter more than any portfolio comparison. Check that the campaign reaches people you can actually serve before applying a broad-audience lesson.
Your conversion is an early step, not a sale. Demographic or geographic rows can look efficient while producing different rates of real customers. Use the downstream result when you design a test; nothing here promises an improvement in your account.
Your report periods do not match. A historical cost report and today’s list sizes cannot be joined into a cause. Align the windows, check the settings history where you can, and leave the question open if the export cannot support it.
What to check in your account
- Write the intended rule for each audience. For every important campaign, record the campaign type, each audience’s mode and the exclusions. Mark each audience as a fence, an exclusion, a signal or a label.
- Read the size of every list those campaigns use. Record source, definition, status and size on each network. Anything under 100 on a network is below Google’s minimum there; investigate it before you remove it or change the campaign.
- Sort the Observation report by segment type. Note how much of the observed cost is affinity and how much is your own lists. Match campaigns, level and dates to the campaign totals, and never read the rows as a share of people reached.
- Compare demographics on outcomes that pay. Keep Unknown in the analysis, check that account patterns hold in the important campaigns, and confirm what your bidding strategy supports.
- Treat geography as a business constraint. Read the setting apart from the location-type rows, and decide whether interested users outside your area can become customers.
- Check eligible hours and the phone experience. Look at real schedule coverage and complete the mobile buying journey yourself. Plan a test only once you have found a problem these controls can fix.
Close the audit with a short decision note: what the account was meant to do, what the records show, what remains unknown and which observation would change the decision. Give any proposed test a business measure. An audit can reasonably end with a better explanation of an existing setting.
Researcher’s take
I would start every audience audit in the list library, not in the performance report. The Empty List Majority is not a scandal by itself; some lists are built for a campaign that ended and simply stay behind. What worries me is the one list a campaign depends on, as a fence, an exclusion or a signal, sitting at zero while everyone assumes it works. So my verdict is simple. Before anyone changes who can see your ads, ask for the size of every list your campaigns use, network by network. If nobody can answer, that is your first finding.
Igor Ivitskiy, Doctor Ads Profit Forensics
FAQ
How should I audit Google Ads audience targeting?
Work in order: mode, list sizes, what the Observation report is made of, then demographics, geography, hours and devices. Start with the lists, because in the median account 66.7% of all exported lists showed zero size on both Search and Display. Know which lists your campaigns rely on before you act on any performance row.
Does a zero audience size mean my list is broken?
Not by itself. Search size counts only members who searched on Google in the previous 30 days, so a list can hold people and still show zero. But a list needs at least 100 active users on a network to serve there, so a zero on a list a campaign relies on deserves a look at its source, definition and status.
Can I add up Observation rows to see how much of my spend audiences explain?
As reported cost, yes; as a count of people, no. In our Search exports the rows came to about 40% of matching campaign cost in the median account but about 4% in the median campaign, and affinity segments made up about two thirds of the observed cost in the median account. The rows never summed past a campaign’s cost, yet one person can sit in several segments, so they describe labelled traffic, not unique people.
Should I exclude Unknown age or restrict advertising hours?
Not on these numbers alone. Our companion studies found Unknown-age spend at a median 28.8%, and restrictive schedules on 16.3% of spending campaigns at a later snapshot. Neither shows that changing the setting improves results. Establish a business reason, then test a control your bidding strategy supports.
Method
Doctor Ads Profit Forensics recalculated both new findings from two separate sources. The list inventory uses a 10 July 2026 snapshot of the managed portfolio, with one account refreshed in September 2026. No account appears in both files, so the refreshed account is counted once, and reference spend stops at June 2026. The snapshot holds 5,531 exported lists (accounts: n=125), of which 4,086 show zero size on both Search and Display.
Both size fields are complete. List type is blank in every row and status is not recorded, so zeros cannot be split by type or explained. Every exported list counts, including unused ones. The account median is 66.7% and the pooled share 73.9%. Leaving out each account in turn never moves the median, and the pooled share stays between 69.4% and 75.1%.
The account holding the most lists has 16.4% of all lists and 21.5% of the zero-size lists; without it, the pool is 69.4% (3,206 of 4,622 lists). The median also stays at 66.7% without the largest spender, chosen on spend from January 2023 to June 2026, and with one account per recorded family of related accounts (n=112).
The Observation analysis uses Search audit exports instead: each account’s latest dated audience-report window, starting 1 September or 16 October 2024 and ending between 15 and 31 January 2025 (accounts: n=8; 880 Search campaigns with positive cost). With fewer than ten accounts, it is exploratory. Only campaign-level Observation rows count; 93 campaigns with ad-group-level rows or whole-history windows and 178 ambiguous campaign names are excluded before matching by name within account and window. Paused and removed campaigns keep their spend, and costs are converted to USD at a fixed rate per currency.
Summed Observation-row cost is divided by matching campaign cost inside each account. The account median is 0.397, about 40%, and the pooled ratio 0.330, about a third. Leave-one-account-out medians run from 0.379 to 0.416; without the largest spender, the median is 0.379 and the pool 0.227. Account ratios range from 0.018 to 0.666.
The median campaign ratio is 0.036: 517 of 880 campaigns sit below 0.05 and hold 35.3% of matched spend, while 221 sit at 0.30 or above and hold 51.7%. No campaign’s row sum exceeds its cost; the highest campaign ratio is 0.872. Segment-type shares are weighted by cost across all observed rows, not medians of accounts: affinity 0.825, in-market 0.099, combined 0.038, detailed demographics 0.026, website visitors 0.007, custom combination 0.005 and customer segments 0.0002. Similar segments and installed-app categories carry no cost.
Without membership overlaps, event identifiers or attribution history, the rows cannot be turned into unique people; no conversions are combined across accounts. The five companion figures come from the published articles, with their own populations and windows. This is an agency-managed and audited portfolio, not a random sample of advertisers. The two new analyses use different samples and dates, and neither establishes a cause, wasted spend, a defective list or a targeting breach. We will recompute both on the next audit exports and the next portfolio snapshot.

