

TL;DR abstract. Are Google Ads cheaper at weekends? Doctor Ads Profit Forensics compared Saturdays and Sundays with weekdays inside each account, in four separate windows: three full years and the first half of 2026. In 2025 the median of the account-level weekend-to-weekday ratios was 0.98 for cost per click, about 2% cheaper, and 0.90 for conversion rate, about 10% lower. Computed as its own ratio, cost per conversion had a median of 1.05. The lower weekend conversion rate repeats in 2023, 2024 and the first half of 2026.
The day view is steadier at its ends than in its middle. In the cross-account median profile of every window, Monday converted best and Sunday worst against each account’s own weekly average, with Saturday second worst; the days in between change places from year to year. The effect is modest and depends on which accounts you keep: click thresholds leave the cost gap near 5%, while keeping only accounts with plenty of weekend conversions shrinks it to about 1%. About six accounts in ten show a weekend penalty. The cheap click is real, and it is not the whole story.
The weekend question has two folk answers. One says weekends are cheap because competitors switch off, so buy them. The other says weekends are dead, at least for B2B, so switch off. Both are said with confidence and neither is often checked, because the one comparison that matters, the same advertiser on different days, is buried in each account’s day of week report and almost never published across accounts.
What has been published does not agree with itself. A 2011 academic study of a single hotel chain’s search advertising found that weekend returns were lower mainly because weekend clicks cost more, not because people converted less. A 2026 note from a UK healthcare agency, pooled across its private healthcare accounts, found the opposite mechanism: weekend clicks were cheaper and weekend cost per acquisition was higher, most of all on Sunday. WordStream’s guide to ad scheduling describes B2B accounts that are weak outside business hours and advises checking your own data.
The closest multi-account figure comes from B2B software. GrowthSpree’s report on 43 enterprise B2B SaaS accounts gives a weekend conversion rate of 0.8% against 2.7% on weekdays, pooled across those accounts. That is one industry, and a level for the whole group rather than a comparison made inside each account. None of these sources says how many accounts, across different kinds of business, sit on each side of the line. That is what we counted.
At weekends the click is about 2% cheaper
For each account we added up Saturday and Sunday, then Monday to Friday, and divided the weekend figure by the weekday figure. We kept accounts with at least 100 clicks on each side and at least 10 weekday conversions in the year. Every comparison stays inside one account, so different businesses and different conversion setups never get mixed. The figures below are medians of those account-level ratios, each computed on its own.
In 2025 the median weekend cost per click ratio was 0.98. Leaving out any single account moves it by no more than a thousandth. The click was cheaper at weekends in about six accounts in ten. That is the direction the cheap-weekend theory predicts, and the size is small. This data cannot say why. Fewer competitors, a different mix of devices and campaigns, and automated bidding pricing the weekend lower are all possible.
Click-through rate barely differs: the median weekend ratio is 1.01.
The weekend conversion rate is about 10% lower
The conversion side is where the weekend loses. The median weekend conversion rate ratio was 0.90, about 10% lower, with a leave-one-out range of 0.897 to 0.905. It was lower in about six accounts in ten, and at least 20% lower in about a third.
Cost per conversion, computed as its own ratio inside each account rather than from the two medians above, has a median of 1.05. It was higher at weekends in about six accounts in ten and at least 20% higher in about three in ten. In the typical account the slightly cheaper weekend click does not make up for the lower weekend conversion rate.
Monday high, Sunday low
The weekend framing suggests a switch that flips on Saturday morning. To see the whole week we set each day’s conversion rate against the same account’s weekly average and took the median across accounts, separately for every window.
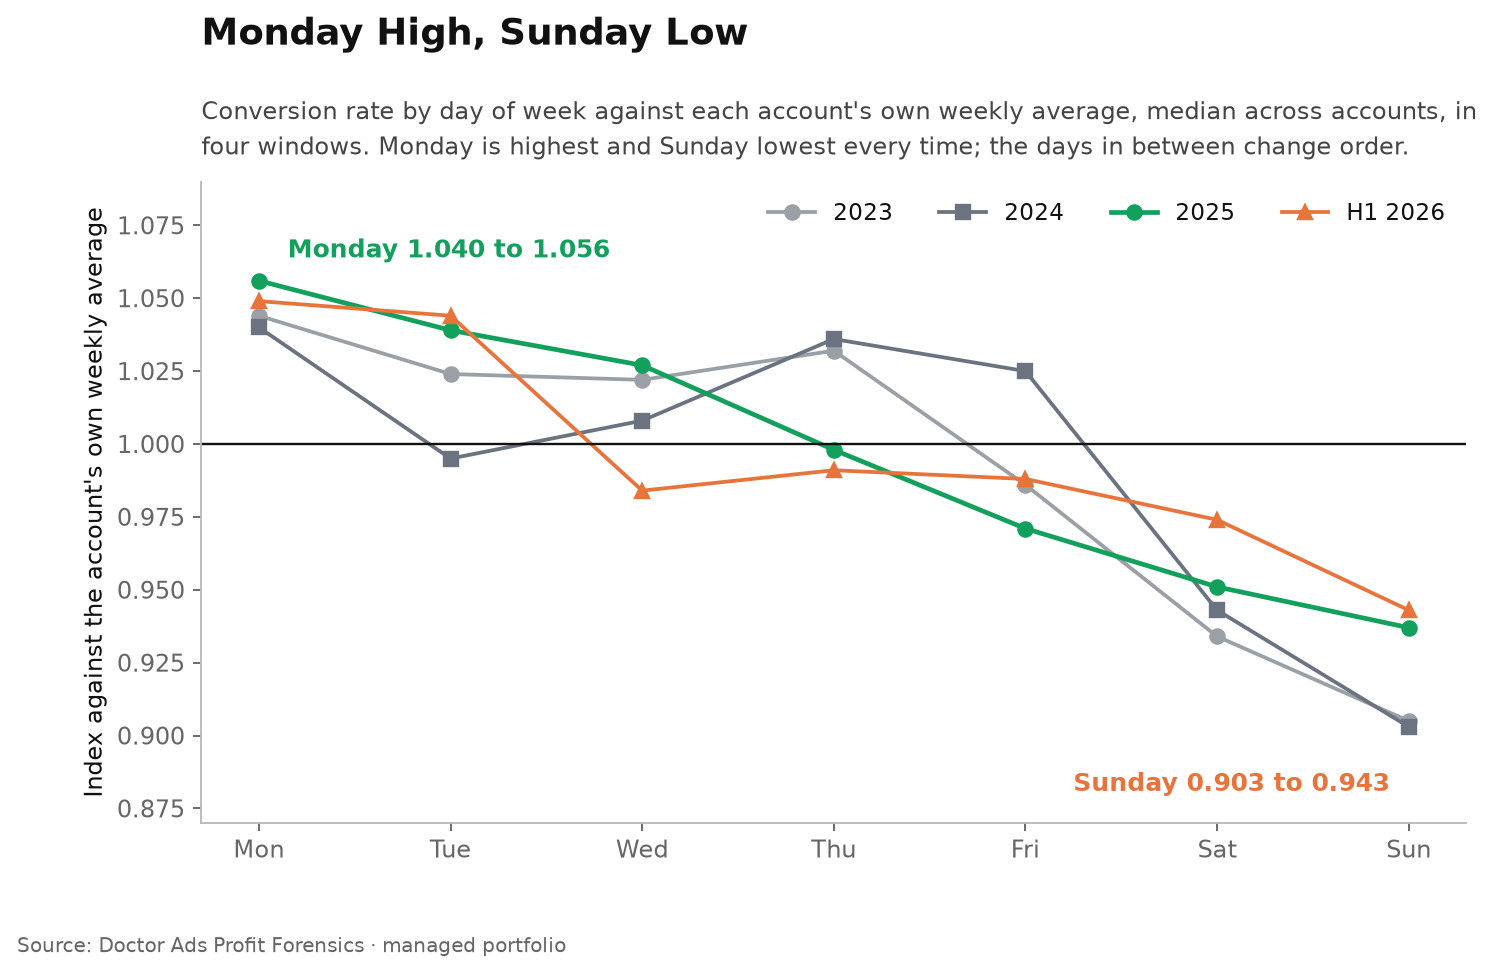
The ends hold in every window. Monday is the best day each time, between 1.040 and 1.056 of the account’s weekly average. Sunday is the worst each time, between 0.903 and 0.943, and Saturday is second worst each time. The middle of the week does not keep an order: in 2023 Thursday beats Wednesday, in 2024 Friday beats Tuesday, and in the first half of 2026 Wednesday dips below Friday.
In 2025 alone the profile looks like a clean slide, 1.056 on Monday down to 0.937 on Sunday with every day a little below the one before, but that exact shape does not repeat in the other windows, so we do not read it as a law. The safe reading is narrower: the weekend is the low end of the week in these accounts, and Monday is the high end.
The weekend gap repeats in every window
One year could be a fluke, so we ran the same comparison on every year the data allows. The weekend conversion rate ratio is 0.91 in 2023, 0.87 in 2024, 0.90 in 2025 and 0.91 in the first half of 2026. The weekend cost per conversion ratio is 1.08, 1.06, 1.05 and 1.05. The weekend cost per click ratio stays between 0.96 and 0.98.
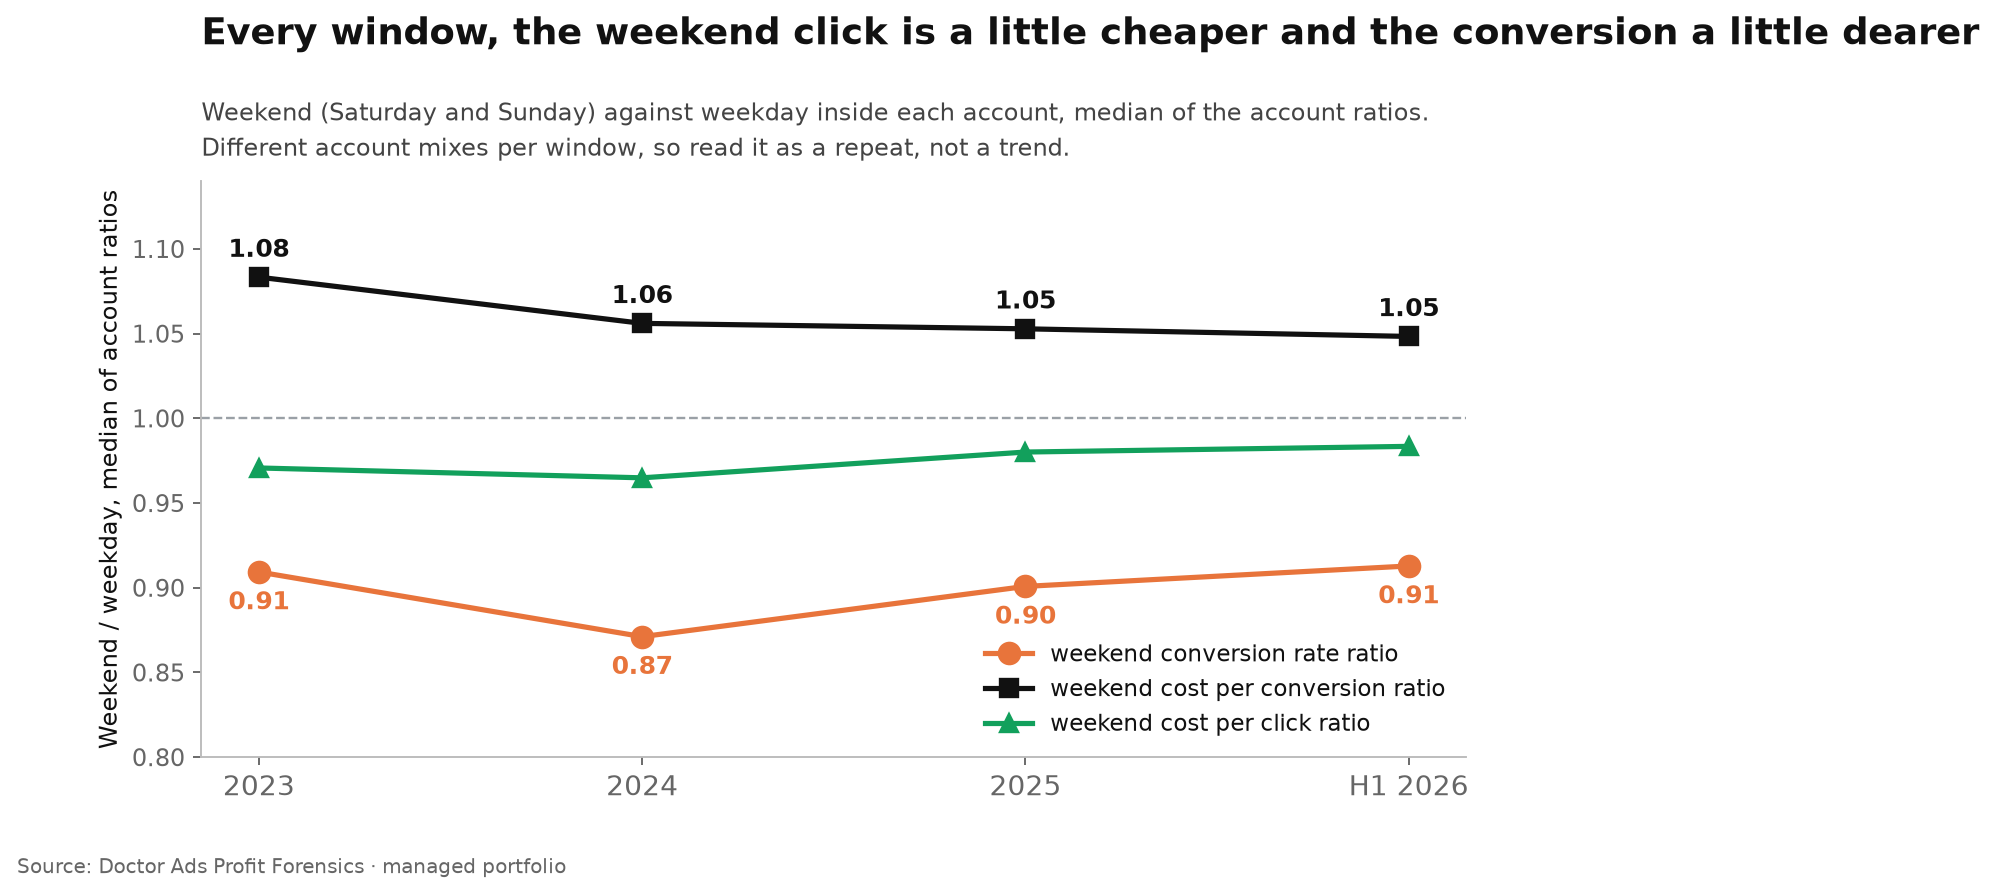
Different accounts enter each year, so this is a repeated finding rather than a trend. The first half of 2026 is also the most recent window, where the last weeks’ conversions were still arriving when the data was pulled; it agrees with the full years, which is reassuring rather than decisive.
How big the gap looks depends on which accounts you keep
We tested the thresholds. Raising the click floor to 300 or to 1,000 clicks on each side leaves the median cost per conversion ratio at 1.05 and 1.045, and the conversion rate ratio at 0.905 and 0.923. The gap survives.
Requiring at least 300 clicks and 30 conversions on the weekend as well as on weekdays changes the picture: the conversion rate ratio becomes 0.95 and the cost per conversion ratio 1.01. That filter selects on the weekend result itself and changes which accounts are counted. We keep the click-based filter as the estimate. The 1.01 is the smallest median among the six variants we ran, not a lower bound on the effect. Across those variants the median weekend premium on a conversion ranged from about 1% to 5%.
Is it just B2B?
The usual explanation is that B2B buyers stop working on Friday afternoon. If that were the whole story, businesses selling to consumers should do as well or better at weekends. Ecommerce, the largest consumer vertical in the portfolio, does not: its median weekend conversion rate ratio was 0.85 in 2025, 0.87 in 2024, 0.91 in 2023 and 0.92 in the first half of 2026. Online shops show the weekend dip too.
B2B does look weaker, but only one year has enough B2B accounts to report, and we will not build a headline on it. The software-only figure above implies a far larger gap than our median account shows. The honest statement is narrower: the weekend conversion dip is not a B2B peculiarity, because consumer businesses show it as well.
Your account tends to stay on its side
Among accounts we could measure in both 2024 and 2025, seven in ten stayed on the same side of the line. Because more accounts sit on the losing side than the winning side, chance alone would keep a little over half of them in place, about 56% here, so seven in ten is more persistence than chance, though not a lot more. The rank correlation between the two years is 0.33. Your own day of week report says something about your account, and it can change.
Spend barely tilts either way
How does the money actually fall? Pooled across the accounts in this comparison, weekends took 28.8% of 2025 spend. 2025 had 104 weekend days out of 365, so an even split would give 28.5%. Inside the median account the tilt is the other way: weekends took 27.3% of spend, and a weekend day got 0.94 times the money of a weekday. Either way the shift is small. This is realised spend, not a budget decision, so it cannot tell us whether anyone chose to move money.
Automated bidding is part of the picture. Google lists day of week among Smart Bidding’s auction-time signals: “Google Ads can optimize bids based on someone’s local time of day and day of week in their time zone.” It also ignores manual day and hour bid adjustments under Smart Bidding, while still respecting the ad schedule. Part of any weekend price difference may already be the bidding system’s response, which this data cannot separate out. Our own count of how many campaigns restrict their hours at all found that most do not.
When this does not apply
Your customers act at weekends. Some businesses invert the pattern; WordStream names home improvement as a typical weekend performer. Our medians describe the typical account, and about four accounts in ten do not follow it.
Your offline conversions are not imported, or not yet. Standard conversion columns credit a conversion to the date of the ad click, so a Saturday lead called back on Monday still counts on Saturday. What distorts a day of week report is conversions that never reach the account, and the most recent weeks, where conversions are still arriving.
Your volume is small. With a few dozen conversions a week, one good Saturday can flip your ratio. The persistence figure above comes from accounts with enough volume on both sides.
Your market keeps a different working week. This is an agency-managed portfolio, not a random sample of advertisers, and it leans toward Europe and international businesses. Day of week effects depend on local working weeks.
How to check yours in two minutes
- In Google Ads, open the report for day and hour, or add the Day of week segment to the campaigns view, for the last full year.
- Add Saturday and Sunday together, and Monday to Friday together. Divide weekend conversions per click by weekday conversions per click.
- Do the same for cost per conversion. A gap of a few percent is within what these accounts show and is hard to tell from noise at modest volumes.
- If the weekend cost per conversion is 20% or more above the weekday figure two years in a row, treat that as a hypothesis worth testing, for example a lower weekend bid on manual bidding or a schedule experiment, and measure volume as well as cost before you remove any days.
Key takeaways
- In 2025 the median account-level weekend ratio was 0.98 for cost per click and 0.90 for conversion rate.
- Computed on its own, the median weekend cost per conversion ratio was 1.05; about six accounts in ten show a weekend penalty.
- In every window from 2023 to the first half of 2026, Monday converted best and Sunday worst; the 2025 day-by-day slide does not repeat exactly.
- The gap survives stricter click thresholds but shrinks to about 1% if only accounts with plenty of weekend conversions are kept.
- Seven in ten accounts stayed on the same side from 2024 to 2025, more than the 56% chance would give: check your own report before you touch the schedule.
Researcher’s take
I get asked about weekends in almost every account review, and the question is nearly always framed as on or off. In this data the typical weekend costs a few percent more per conversion, and how many percent depends on which accounts you count. That is not a reason to switch anything off. It is a reason to put your own day of week report for two years side by side before you decide. If your weekend is 30% dearer in both, you have a stable pattern in your own report that is worth a proper test. If it is 5%, weigh it against how much you spend at weekends and what a test would cost before you act.
Igor Ivitskiy, Doctor Ads · 19 years · $770M managed spend
Method
Doctor Ads Profit Forensics is the research desk of a Google Ads practice with 19 years and $770M managed spend behind it.
Data statement v.2026.09. Source: the hour and day of week report of each account in a managed Google Ads portfolio analysed by Doctor Ads Profit Forensics, read from a snapshot dated 10 July 2026, with yearly windows 2023, 2024 and 2025 and a half-year window for January to June 2026. Day of week is in each account’s own time zone. Accounts are pseudonymised; no account, campaign or vertical name is published beyond the coarse ecommerce class.
Definitions. Weekend is Saturday plus Sunday; weekday is Monday to Friday. For each account every ratio is the weekend value divided by the weekday value of the same metric, and each reported median is taken over those account ratios separately, so the cost per conversion median is not the cost per click median divided by the conversion rate median. Accounts enter a window with at least 100 weekend clicks, at least 100 weekday clicks and at least 10 weekday conversions: 72 accounts in 2025, 55 in 2024, 52 in 2023 and 58 in the first half of 2026; cost per conversion excludes accounts with no weekend conversion, which leaves 71 in 2025 and 53 in 2024. The day profile uses accounts with at least 700 clicks and 35 conversions in the window, each day’s conversion rate divided by the account’s own weekly rate: 51 to 53 accounts in 2023, 53 to 54 in 2024, 67 to 68 in 2025 and 50 to 52 in the first half of 2026. Persistence uses the 50 accounts that pass the filter in both 2024 and 2025: 26 were worse at weekends in both years, 9 better in both, 9 moved from worse to better and 6 from better to worse; independence with those margins would give 55.6% agreement against the observed 70%. Ecommerce figures use 22 accounts in 2025; verticals with fewer than 7 accounts in a window are suppressed.
Sensitivity, 2025. At least 300 clicks on each side: 71 accounts (70 for cost per conversion), conversion rate ratio 0.905, cost per conversion 1.05. At least 1,000 clicks on each side: 65 accounts (64), 0.923 and 1.045. At least 300 clicks and 30 weekday conversions: 67 accounts (66), 0.928 and 1.045. At least 300 clicks and 30 conversions on both sides, which selects on weekend outcomes: 58 accounts, 0.952 and 1.011.
Weighting. Medians across accounts, each recomputed leaving one account out at a time. Conversions are never pooled across accounts; the only pooled figure is the weekend share of spend. Medians and quartiles use one engine with linear interpolation.
Limitations. Four. Conversions follow each account’s own settings and are credited to the click date; missing offline imports and the still-maturing last weeks of the first half of 2026 can shift the ratios. The report aggregates all campaign types in the account, so the weekend and weekday traffic can differ in campaign, device and audience mix. Nothing here is causal: the comparison describes what the accounts recorded, not what would happen if a schedule changed. And the portfolio is agency managed, not a random sample of advertisers.
Changelog. First published September 2026. Recomputed quarterly against the live claim registry.
What to read next
- The dead hours in your Google Ads account, the same question asked of the hours in a day.
- Only 16.3% of spending campaigns restrict their hours, on how rarely the schedule is used at all.
- The median account puts 78.9% of its spend on mobile, the other half of when and where the budget goes.


