

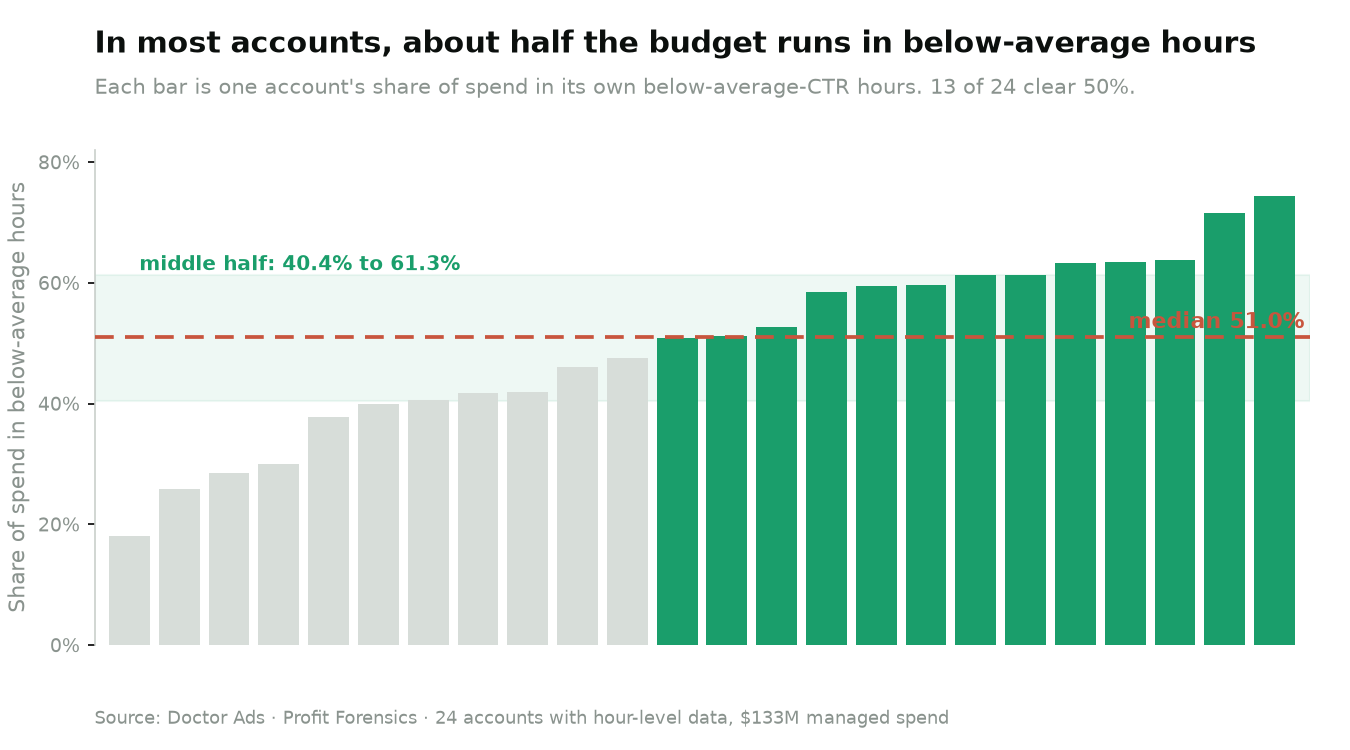
The short version. Most owners assume Google spreads the budget across the day in roughly the right way, so ad scheduling feels optional. In the accounts I examine it is not optional at all: the median account runs 51.0% of its spend in hours when its own click rate is below its daily average. Dayparting is a report Google Ads never shows you, and half the money is sitting on the wrong side of it.
- The share of budget running in these below-average hours spans 40.4% to 61.3% across accounts, and about half put more than half their money there.
- The pattern is the opposite of what the daytime rush suggests. In this portfolio, click rate is highest overnight and lowest between noon and 4pm, yet spend peaks in exactly those low-click afternoon hours.
- The same blind spot hits devices. In three in four accounts mobile is both cheaper and better-clicked than desktop, and the reflex to bid mobile down quietly penalizes the stronger surface.
None of this is printed in a Google Ads report. It is found by comparing each hour against the account’s own baseline, which is analysis, not a screen you open.
Is ad scheduling worth it in Google Ads?
Yes, and the reason is bigger than most owners expect. Ad scheduling, or dayparting, means setting when your ads run and how hard they bid by hour and by day. It sounds like a minor tuning knob. The data says it governs where half your budget goes. Across $133M in managed spend, the median account runs 51.0% of its money in hours whose click rate is below that same account’s all-day average.
Read that again, because the comparison is the whole point. This is not 51.0% of spend in some analyst’s idea of a bad hour. It is 51.0% in the account’s own weak hours, measured against its own average. Half the budget is working in the half of the clock where that specific account gets its lowest engagement.
The exposure is wide and it is common. Across the accounts with enough hour-level detail to measure it, the share running in below-average hours ranges from 40.4% to 61.3%, and about half of those accounts push more than half their spend into it. Weighted by dollars the figure is lower, 29.5%, because a few very large accounts schedule more tightly than the rest. Both numbers are true and they say the same thing in two voices: the typical account is badly exposed, and even the disciplined ones leave spend in their own weakest hours.
The hours you would never guess
The busy-looking hours are the worst-clicked hours. When you pool the day across these accounts, the click rate is highest in the dead of night and lowest in the middle of the afternoon. Around 1am the blended click rate sits near 1.0%. By 3pm it has fallen to roughly 0.5%, its low point of the day, before recovering in the evening.
Now lay spending on top of that curve. Spend does the exact opposite. It thins out overnight, near 3% of the day per hour, and swells through the afternoon, above 5% per hour from noon to 4pm. The money flows in precisely when engagement is at its lowest, and thins out in the cheap-attention hours when people actually pay attention.
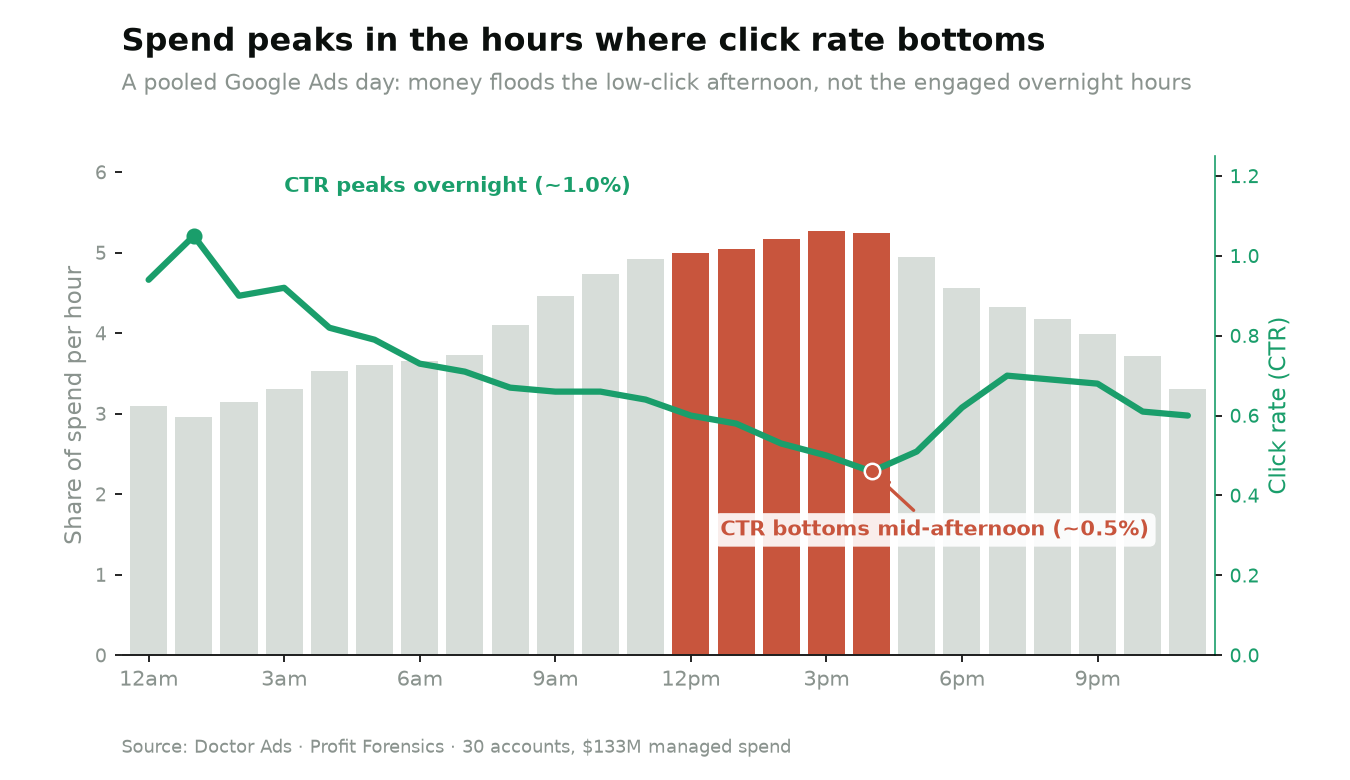
This is attention arbitrage, and the crowd is on the wrong side of it. Everyone bids the visible daytime because that is when the office is awake and the account looks alive. The engagement, and the cheaper clicks that come with it, sit in the hours nobody is watching. You are not buying attention when you spend at 3pm. You are buying company in the auction.
Update, September 2026: the same share on a new snapshot
We re-ran the measurement on a newer and larger snapshot of the managed portfolio, with the same definition: an hour counts as below average when the account’s click rate in that hour, across all days of the week, is under the account’s own all-hours click rate. In 2025 the median account ran 50.3% of its spend in those hours, with the middle half of accounts between 43.9% and 62.4%; leaving out any single account keeps the median at 50.3% to 50.4%. The share was 48.4% in 2023, 50.1% in 2024 and 50.5% in the first half of 2026.
The shape of the day held too. Against each account’s own average, the click rate ran highest from 1am to 6am, at 1.03 to 1.08 times the account average, and lowest from 9am to 4pm, at 0.97 to 0.99, while the median account put between 6% and 7% of its spend into each hour from 9am to 2pm. The week has a shape as well: the same accounts converted best on Monday and worst on Sunday, which we cover in a separate study of weekends. How few campaigns restrict their hours at all is in our count of ad schedules.
Why the money drifts into the dead hours
The drift is mechanical, and it is nobody’s decision. Left alone, a campaign spreads its budget toward whenever demand and competition are highest, and that clusters in business hours. Unless you actively shape the schedule, the account inherits the crowd’s clock instead of its own click pattern. The default is not neutral. It follows the traffic, and the traffic is busiest where attention is thinnest.
The trap is that the afternoon looks productive. Impressions are high, spend is moving, the graphs climb. None of that is the same as engagement. An hour can post the most impressions and the most spend while quietly holding the worst click rate of the day, and the dashboard will still light up green. Volume is not attention, and the account cannot tell the difference for you.
Profit Forensics
I examine one week of your Google Ads account and find the money it is losing, or prove it is clean. Signed, either way. For accounts spending $50,000 or more per month.
Mobile is the cheap seat you are taxing
The device split runs the same blind spot as the clock: the stronger surface is the one getting penalized. Across accounts with both surfaces, the median account gets a click rate 33.1% higher on mobile than on desktop, and pays 24.0% less per click to get it. Higher engagement, lower price, on the same account.
It holds almost everywhere. Mobile has the higher click rate in about four in five accounts, the lower cost per click in about nine in ten, and both at once in three in four. So in three of four accounts, mobile is simply the better buy on both counts. Yet the standard reflex is to bid mobile down, because a mobile visit feels lower intent. That reflex penalizes the cheaper, more engaged surface and hands the budget back to the pricier one.
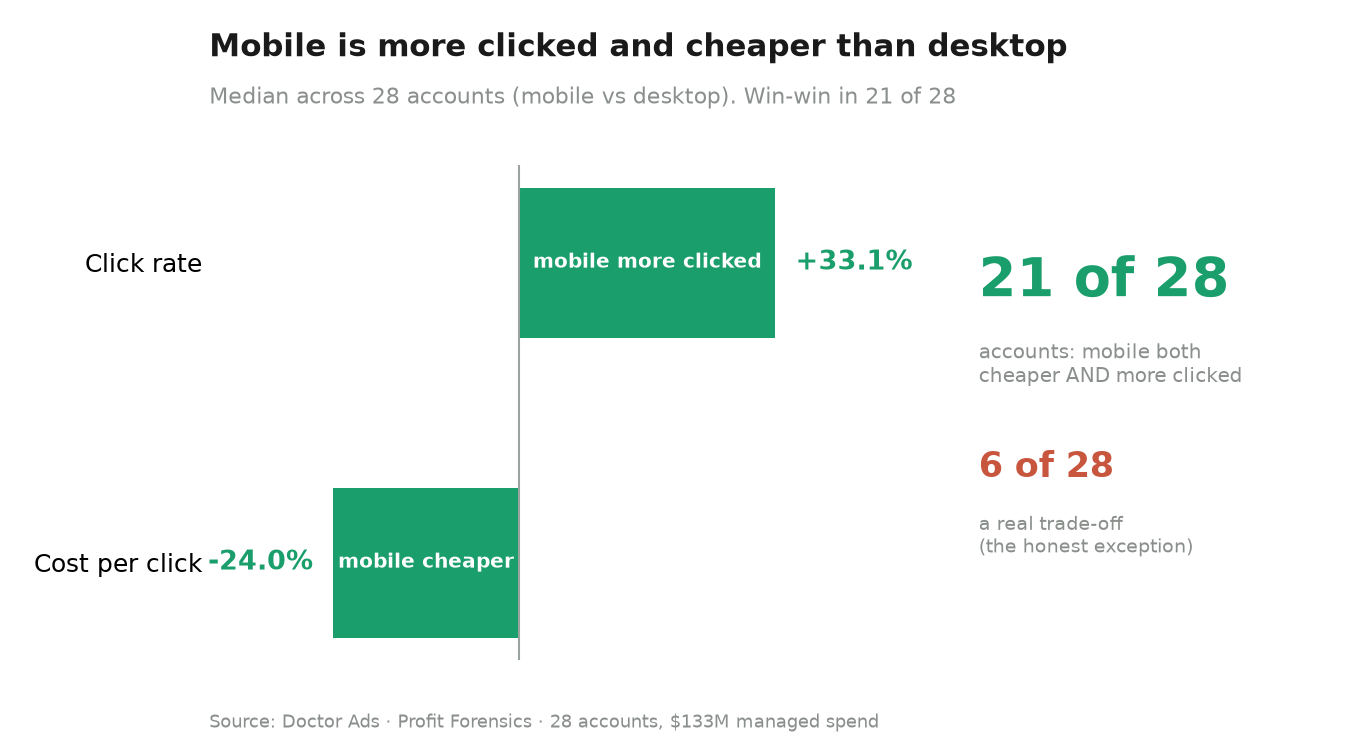
There is an honest exception, and it matters. In about one in five accounts the two numbers move together, so mobile is more clicked but also more expensive, a real trade-off rather than a free win. That is why the fix is never a blanket mobile bid. It is checking your own account’s two numbers before you touch the adjustment, because the average hides a minority where the reflex is right.
What to do instead of trusting the daytime
- Build the hour curve against the account’s own baseline. Pull click rate by hour, compare each hour to the account average, and mark the hours that sit below it. That single view is the report Google Ads will not draw for you, and it is where the 51.0% hides.
- Reshape bids by hour before you cut hours. The goal is not to switch off the afternoon. It is to stop overpaying for it and to stop starving the cheap, high-engagement hours the crowd ignores. Shift weight, do not just amputate.
- Read your device split as two numbers, not one feeling. Check click rate and cost per click on mobile versus desktop for your account before applying any device adjustment. In most accounts the reflex to bid mobile down is backwards.
- Treat the schedule as a decision, not a default. The below-average-hour share is not printed anywhere. It is produced by comparison and math, and left alone it drifts to the crowd’s clock. Owning the schedule is owning where half the budget lands.
| Lever | What most owners do | What actually moves the money |
|---|---|---|
| Hours | Trust the default and watch the daytime graphs climb | Compare each hour to the account’s own click-rate baseline |
| Bids by hour | Leave delivery to follow business-hour demand | Reweight toward the engaged hours, ease off the low-click peak |
| Devices | Bid mobile down on a feeling of lower intent | Read mobile click rate and cost per click first, then adjust |
Researcher’s take
Owners assume the busy afternoon is where the money should be. The accounts disagree. In nearly every audit I run, the median account pushes most of its budget into the hours where its own click rate is lowest. Not because anyone chose it, but because a default followed the crowd into business hours, and an account-relative average kept it looking normal. The same reflex bids down the device that earns the cheaper, more engaged click. You are budgeting by the clock you remember. The account runs on a different one.
Igor Ivitskiy, PhD, Doctor Ads
When this does not apply
Your campaigns run on Smart Bidding. Google states that Smart Bidding respects ad schedules but ignores manual hourly bid adjustments, and it already varies bids by time of day. Cutting hours there removes auctions the bidding system might have won profitably.
Your business genuinely never closes. For ecommerce or an app with round-the-clock demand, spend in the small hours is not drift; it is the market being awake.
Your conversions arrive with a delay. A click at midnight that converts at noon is recorded against the hour of the click. In businesses with a long consideration step the hourly click rate is a poor proxy for the hourly value.
Key takeaways
- The median account runs 51.0% of its spend in hours below its own click-rate average; across accounts the share is 40.4% to 61.3%, and about half clear 50%.
- Click rate peaks overnight and bottoms between noon and 4pm, yet spend peaks in that same low-click afternoon. The money floods the low-CTR hours.
- Mobile is both more clicked (median +33.1%) and cheaper (median -24.0%) than desktop in most accounts, and win-win in three in four, yet gets bid down by reflex.
- The fix is comparison, not amputation: reweight bids toward engaged hours, and read your device split as two numbers before adjusting.
- Dayparting is the report Google Ads never shows. Where half the budget lands is decided by whether you build it.
Frequently asked questions
Is ad scheduling worth it in Google Ads?
For most accounts, yes, because it governs where a large share of the budget lands. The median account runs 51.0% of spend in hours whose click rate is below its own daily average. That is not a rounding-error tweak, it is half the money sitting in the account’s weak hours.
What hours are best for Google Ads?
There is no universal clock, because it depends on your account’s own click pattern and time zones. But in this portfolio the counterintuitive result was that click rate ran highest overnight and lowest in the early afternoon, while spend did the reverse. The right move is to compare each hour to your own baseline, not to copy a generic best-hours list.
Should I lower my mobile bids in Google Ads?
Usually the opposite. Across the managed portfolio mobile had a 33.1% higher click rate and a 24.0% lower cost per click than desktop at the median, and was better on both counts in three in four accounts. Check your own account’s two numbers first, because a minority of accounts do show a real mobile trade-off.
Does dayparting reduce wasted spend?
It moves the budget to better hours rather than deleting spend, so it is a reallocation, not a cut. The gain is buying more engaged, often cheaper clicks in hours the crowd ignores, instead of overpaying in the busy afternoon when the click rate is at its worst.
Method and sources
Doctor Ads Profit Forensics is the research desk of a Google Ads practice with 19 years and $770M managed spend behind it.
The September 2026 update uses the hour and day of week report of a 10 July 2026 snapshot of the managed portfolio: accounts with at least 2,000 clicks and data in at least 20 of 24 hours in the window, 69 accounts in 2025, 58 in 2024, 51 in 2023 and 52 in the first half of 2026; the hourly profile is the median across accounts of each hour’s click rate over the account’s all-hours rate.
Figures come from a forensic analysis of Google Ads accounts representing $133M in managed spend, measured over each account’s primary reporting window, most spanning September 2024 to February 2025. Of 31 accounts, 24 had enough hour-level detail to measure the below-average-hour share and 28 had a mobile-and-desktop split. A below-average hour is defined per account, as an hour whose blended click rate is under that same account’s all-hours click rate in the same window, so the measure is account-relative and descriptive, not a claim about profit. This is a managed-agency portfolio with client self-selection and a wide range of account sizes, so the figures describe these accounts rather than Google Ads as a whole. The hourly curve is pooled across accounts of mixed time zones and is illustrative of the shape; the 51.0% figure is the account-level median and is the robust claim, unchanged when the single largest account is removed. Click rate is clicks divided by impressions and cost per click is cost divided by clicks; conversions are never pooled across accounts. Related reading: bid adjustments and how much Google Ads budget is wasted.


