

TL;DR abstract. A Google Ads daily budget reads like a spending plan, and most advertisers treat it as one. Doctor Ads Profit Forensics compared the daily budget of every live campaign, as it stood on 10 July 2026, with what the campaign spent in June. Over the month, the median campaign spent 50.3% of what its daily budget allowed (the daily budget times 30), and about half of all campaigns spent less than half. The split by campaign type is the real story: Search campaigns spent a median 28.8% of their budget, while Performance Max spent 80.7%.
For Search, Google’s own lost impression share metric says the under-spenders were rarely budget-limited. Search campaigns using less than half of their budget lost a median 0.0% of impression share to budget, and a median 38.5% to rank; Search campaigns at 90% or more of budget lost a median 19.1% to budget. Only 1.8% of enabled budgets are shared. For most Search campaigns in this data the daily budget was a ceiling they did not reach.
Google’s rules for the daily budget are precise. On its spending limits page, for most campaigns the daily spending limit is twice the average daily budget and the monthly limit is 30.4 times the average daily budget. The budget is a limit with a monthly ceiling.
What nobody publishes is how often campaigns come anywhere near that ceiling. The advice literature explains the “Limited by budget” status and how to fix it, and one consultant writes that more than 80% of the accounts they audit are limited by budget, without a sample or a method behind the figure. We could not find a single multi-account count of how much of their budget live campaigns actually spend. So we took every live campaign in the portfolio that had its own budget and spent money in June 2026, the last full month before our 10 July snapshot, and divided June spend by the daily budget times 30.
About half of all campaigns spent less than half of their budget
The median campaign used 50.3% of its budget. Leave any one account out and the median stays between 45.8% and 58.7%. The spread is wide: the middle half of campaigns ran from 16.8% to 98.6%.
Counted in campaigns, 49.8% spent less than half of their budget, a third spent less than a quarter, and a third spent 90% or more. Fewer than one in five sat in between. A campaign tended either to press against its ceiling or to stay far below it.
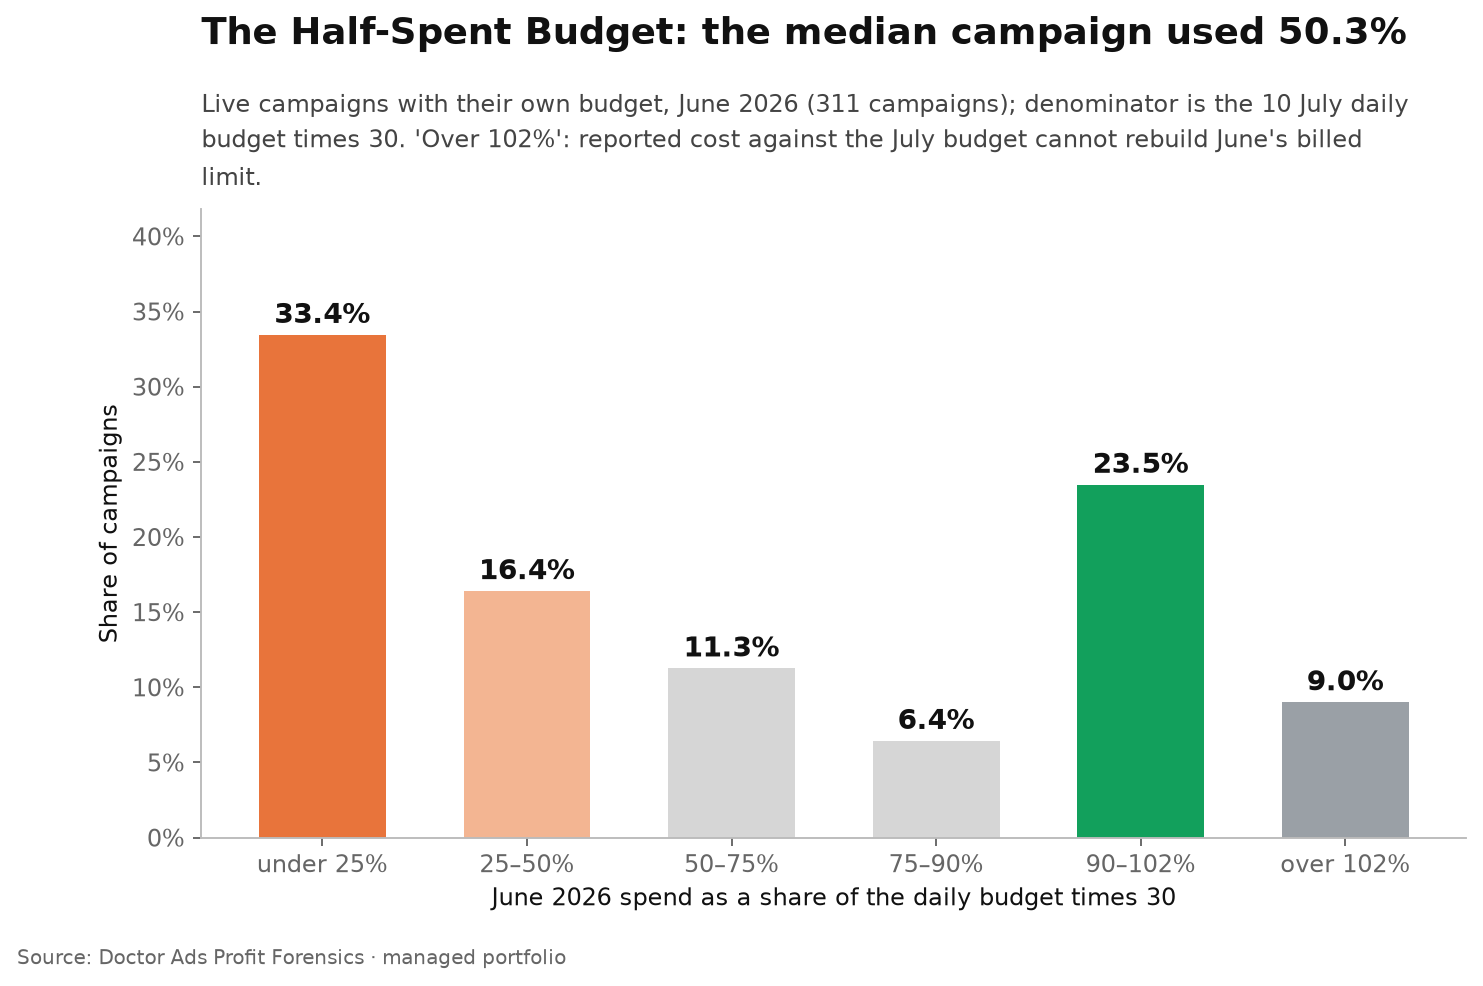
The chart also shows 9.0% of campaigns above 102%. Google caps monthly charges at 30.4 times the average daily budget, which is 101.3% of our measure for a 30-day month, so for these campaigns reported June cost against the July budget cannot rebuild the billed limit that applied in June. Two explanations fit: the budget changed during or after June (Google recalculates the monthly limit from spend already accrued when a budget changes, as its note on how budget changes take effect explains), or reported cost ran above what was billed, which Google allows for and credits back. The data cannot tell the two apart for a given campaign. We show these campaigns rather than drop them, because they are the visible half of a known weakness: a budget raised after June would make a campaign look like an under-spender, and that case is invisible. The spend-in-all-three-months check in the next section and Google’s own budget-lost metric further down are the checks we could run; neither can measure how budget changes moved the overall median.
Campaigns that spent in all three months
A campaign switched on in the middle of June, or paused before the end, would under-spend on paper. So we repeated the count on campaigns that also spent money in May and in the first days of July. Among them the median was 57.7%, and 47.4% still spent less than half of their budget. This removes campaigns born or stopped around June, but not pauses inside June, which the monthly data cannot see. The median moves by seven points and the half-spent picture stays.
Search spends 28.8%, Performance Max 80.7%
The overall median hides two different machines. Search campaigns spent a median 28.8% of their budget, and two in three spent less than half. Performance Max campaigns spent a median 80.7%, and 45.2% of them spent 90% or more. Among campaigns that spent in all three months the two medians are 30.1% and 82.3%.
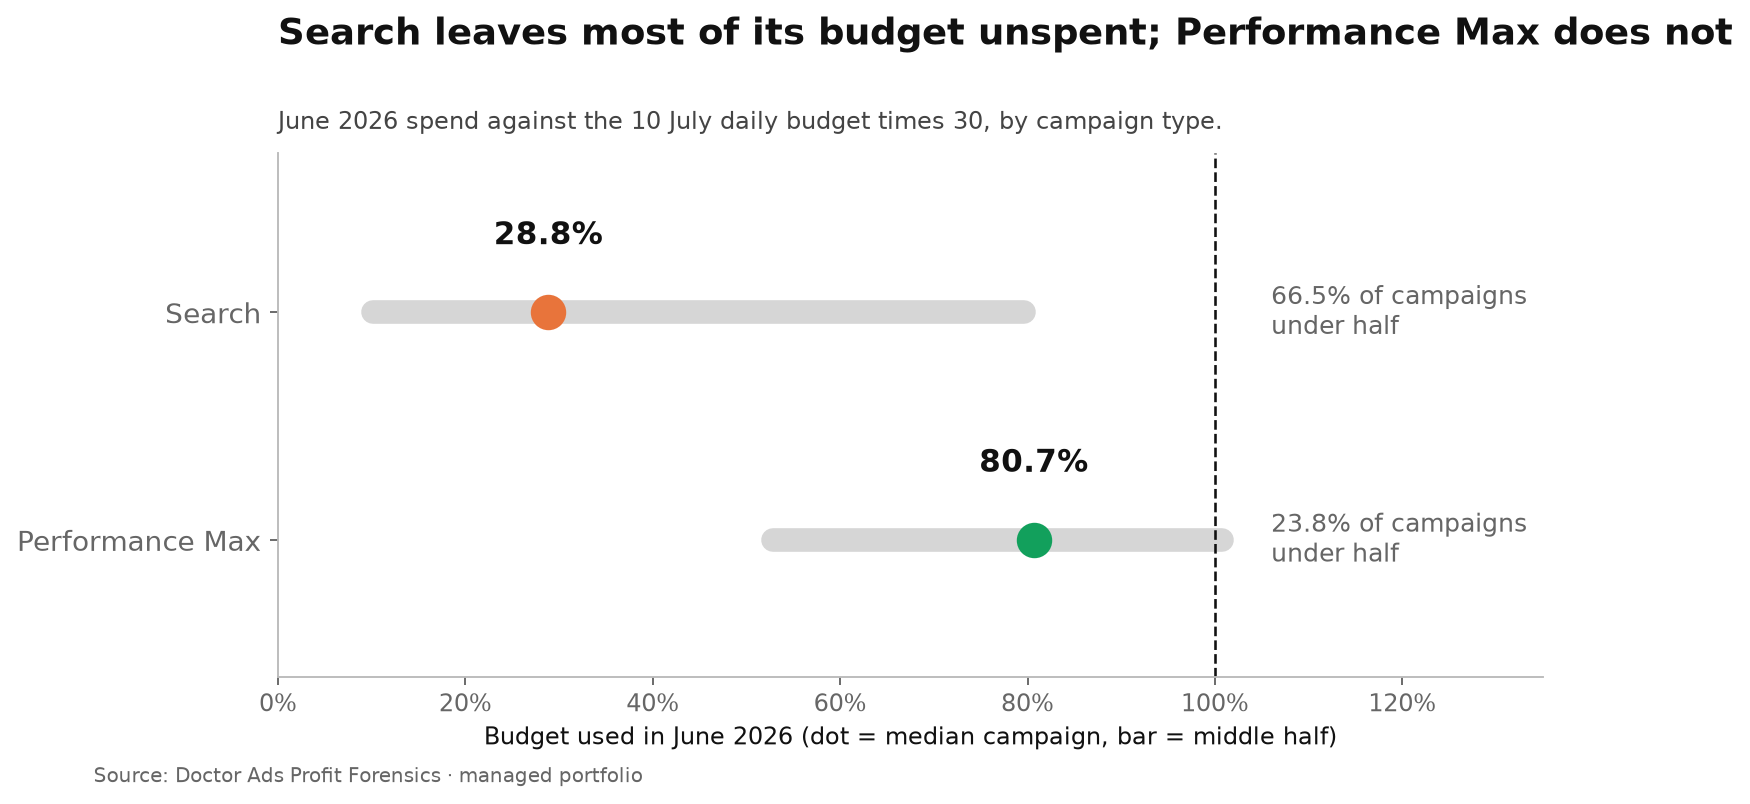
One plausible reading is about what each campaign type can buy. A Search campaign can only spend on the searches its keywords match, at the positions its bids and ad quality win, while Performance Max buys across Search, Shopping, YouTube, Display, Discover, Gmail and Maps. That is a hypothesis, not something this data tests: the two types also carry different goals, advertisers and deliberately chosen budgets. What the data shows is that Performance Max campaigns sat near their ceiling far more often than Search campaigns did.
Measured in money rather than campaigns, the picture tilts toward the constrained side: 45.0% of June spend went through campaigns at 90% or more of their budget, and only 13.2% through campaigns spending less than half. The campaigns that hit their ceiling are, on the whole, the ones carrying the money.
Google’s own metric points the same way
The strongest check is independent of our method. For Search campaigns Google reports how much impression share was lost because of budget. If our under-spenders were really budget-limited, perhaps because their budget was raised after June so that the July figure overstates what they had in June, Google’s metric would show it.
It does not. Search campaigns that spent less than half of their budget lost a median 0.0% of impression share to budget. Campaigns between half and 90% lost a median of 2.0%. Campaigns at 90% or more lost a median of 19.1%, and every one of them lost some.
The median is not hiding a cluster of starved campaigns, but it is not a clean zero either. Just under half of the under-spenders lost some impression share to budget, and three quarters lost less than 1%. About one in nine lost 10% or more. For those few, the budget may well have been binding on some days, or lower in June than in the July snapshot. As a group, the under-spenders were rarely budget-limited.
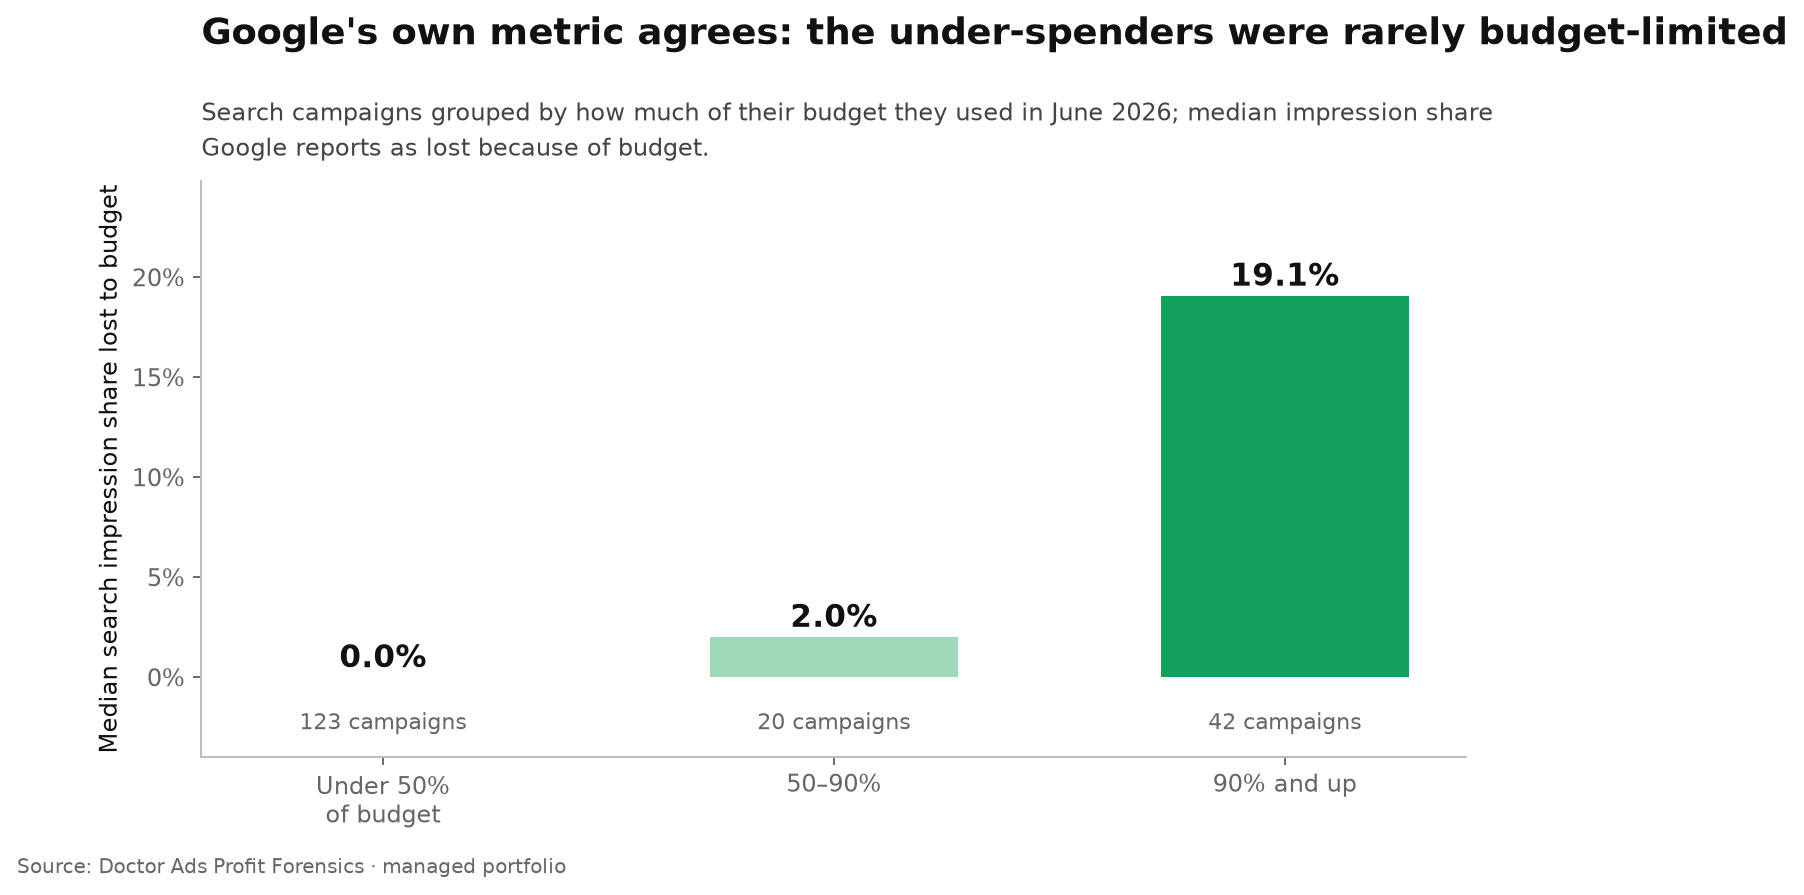
Where the under-spenders lost impressions, Google’s report attributes most of it to rank. They lost a median 38.5% of impression share to rank: auctions they were eligible for and lost on bid and ad quality. That matches what we found across the portfolio’s lost impression share, where rank rather than budget accounted for almost all of it. It also matches the pattern in high-spend portfolio strategies, where campaigns that looked starved were losing to rank.
Bid strategy splits the picture rather than explaining it
One more guess worth testing: automated bidding holds spend back to protect a cost per conversion, so under-spending is just Smart Bidding being cautious. Among Search campaigns, the 124 on Maximize Conversions spent a median 26.0% of budget, and the 23 on manual CPC, a small base, spent 26.6%. Those two are nearly identical. But the 12 Search campaigns on Maximize Conversion Value spent a median 101.1%, their full budget. The groups are small, and the targets set inside each strategy are not part of this comparison, so bidding is not ruled out as a factor. It is simply not one story.
Shared budgets are rare
Google offers shared budgets precisely to move unused money from one campaign to another. According to its help page on shared budgets, advertisers who combine shared budgets with portfolio bid strategies on Search typically see 13% more conversions, and the feature is not available for Performance Max.
Adoption is close to zero. Of all enabled budgets in the snapshot, 1.8% are shared. About one account in five has at least one shared budget anywhere. Among the budgets that actually carried June spend, 6 of 316 were shared, and among Search budgets with June spend, 5 of 189. That is a census, not a missed opportunity we measured: sharing only helps when a capped campaign with a compatible goal can profitably absorb more money, and an under-spending campaign’s unused allowance is permission to spend, not money already set aside. Google’s 13% figure is for shared budgets and portfolio bidding adopted together.
When this does not apply
You run one campaign on a tight budget. A small account with a small budget can be genuinely limited, and then its lost impression share to budget will be well above zero. That number is the test, not the utilisation alone.
Your budget changed during the month. We measure against the budget at the snapshot. A campaign whose budget was raised after June looks like an under-spender here. Google’s budget-lost metric makes that unlikely for most campaigns, not impossible for any one; for your own account, compare against the budget that was actually live.
Your campaign was built to spend less. Target-based bidding can hold spend down on purpose, and a campaign with a tight target and a generous budget will under-spend by design. That is a legitimate choice, and it is still worth knowing that the budget is not what limits it.
You read one month as a rule. This is an agency-managed portfolio, not a random sample of advertisers, and one month of spend. A seasonal peak or trough would shift the level, and we have not tested whether the Search against Performance Max contrast holds in other months.
How to check yours in five minutes
- Take last month’s cost per campaign and divide it by the daily budget times the number of days in the month.
- For every Search campaign under about 50%, add the columns Search lost IS (budget) and Search lost IS (rank). If the budget column is near zero, a bigger budget is unlikely to buy much.
- Look at the rank column instead. That is the share of auctions you entered and lost on bid, ad and landing page quality, and it is one place extra volume can come from.
- If one campaign is capped, still converting at a price you accept, and shares a goal with campaigns that sit below half, a shared budget is one option to test; watch whether the capped campaign’s budget-lost share falls and whether its cost per conversion holds.
Key takeaways
- The median live campaign spent 50.3% of its daily budget times 30 in June 2026; about half of all campaigns spent less than half.
- Search campaigns spent a median 28.8% and two in three stayed under half; Performance Max spent 80.7%.
- Under-spending Search campaigns lost a median 0.0% of impression share to budget and 38.5% to rank; as a group they were rarely budget-limited.
- Across all campaign types, campaigns at 90% or more of budget carried 45.0% of June spend; Search campaigns at that level lost a median 19.1% of impression share to budget.
- Only 1.8% of enabled budgets are shared; whether more sharing would help depends on a capped campaign that can use the money.
Researcher’s take
The most expensive sentence in a client meeting is “let’s increase the budget and see”. I hear it every month, usually about a Search campaign that is already spending a third of what it is allowed. In that situation more budget is unlikely to buy much. If the report says the campaign is losing on rank, the work is in the bid, the ad and the page, and some of that costs money too, but it is a different conversation from the budget line. The budget line is the easiest number to change and, for most Search campaigns, the one that matters least.
Igor Ivitskiy, Doctor Ads · 19 years · $770M managed spend
Method
Doctor Ads Profit Forensics is the research desk of a Google Ads practice with 19 years and $770M managed spend behind it.
Data statement v.2026.09. Source: campaign settings, budgets and monthly campaign performance for a managed Google Ads portfolio analysed by Doctor Ads Profit Forensics, snapshot dated 10 July 2026. Accounts are pseudonymised; no campaign, account or vertical name is published.
Definitions. A campaign enters if it was enabled at the snapshot, attached to an enabled budget that is not shared, and had positive spend in June 2026. Utilisation is June spend divided by the snapshot daily budget times 30, both in the account’s own currency. The all-three-months subset also requires spend in May 2026 and in 1 to 10 July 2026. All 5,068 enabled budgets use standard delivery. The main population is 311 campaigns in 60 accounts carrying $540,137 of June spend, on 310 budgets of their own (one budget served two campaigns); the 6 shared budgets with June spend served 9 campaigns, which gives the 316 budgets counted above; the all-three-months subset is 274 campaigns in 55 accounts; Search has 185 campaigns in 46 accounts and Performance Max 84 in 26. Shared budgets: 90 of 5,068 enabled budgets, in 28 of 133 accounts. The per-account median of campaign utilisation is 69.6%.
Validation. Search lost impression share (budget) and (rank) are Google’s own June 2026 values for each Search campaign: 123 campaigns under half their budget, 20 between half and 90%, 42 at 90% or more.
Weighting. Campaign medians with the middle half, recomputed leaving one account out at a time; money shares are pooled. Medians and quartiles use one engine with linear interpolation.
Limitations. Five. The budget is the one at the 10 July snapshot, not a June history; the 9.0% of campaigns above 102% (28 campaigns, median 1.16 times, maximum 212 times) show that for some campaigns it does not describe June, and campaigns whose budget was raised after June are invisible. Cost is reported cost, not billed cost. Monthly data cannot see pauses inside June. Using 30.4 instead of 30 days gives a median of 49.7%. One month is one season, utilisation says whether the ceiling was reached, not whether reaching it would be profitable, and the portfolio is agency managed, not a random sample of advertisers.
Changelog. First published September 2026. Recomputed quarterly against the live claim registry.
What to read next
- Where your Google Ads impressions actually go, the rank against budget split across the whole portfolio.
- Google Ads portfolio bid strategies, on why starved-looking strategies at scale are usually rank-limited.
- Who actually took the Search partners opt-out, another default that decides where the budget can go.
