

TL;DR abstract. Whether a higher Quality Score means a cheaper click has been charted many times. The famous table is a formula: Click Equations published it in 2009 against an average score of 7, and Larry Kim rebased it to 5 in 2013. Empirical charts followed, among them average CPC by score across 63,000 accounts in 2019 and across 725 accounts in 2022. Those charts pool keywords from many accounts, and pooled keywords come from very different markets. Doctor Ads Profit Forensics asked a narrower question that an account manager actually faces: inside one account, do the keywords with higher displayed scores tend to have lower CPC?
In 23 managed accounts, each with at least 30 keywords that took 10 or more clicks in January to June 2026, the rank correlation between Quality Score and CPC has a median of 0.061, and the accounts scatter from −0.661 to +0.641: 9 negative, 14 positive. The same scores show a median correlation of 0.296 with click-through rate, positive in 20 of 23 accounts. In an exploratory comparison of score 10 against score 5 in 8 accounts, the median CPC ratio is 0.88, and no account reaches half. These are associations between a July score and earlier prices, across keywords that face different auctions. They describe what the displayed score lined up with, not what raising it would do.
The table most people have seen is older than most accounts running today. Larry Kim explained its history at WordStream in July 2013: “In 2009, Craig Danuloff at Click Equations published some charts that showed how much money you save” by raising your score, against an average score of 7. Kim revisited the numbers in March 2013 against an average “closer to 5”, concluding that “having a QS of 10 now saves you 50% over the average advertiser.” Every value in that version is 5 divided by the score, and it is still reprinted, for example in a Store Growers guide titled for 2026 that explains “Google compares your quality score to the average, which is 5/10.”
Google’s documentation holds two statements side by side. Its page on ad quality says that “higher quality ads typically cost less per click than lower quality ads.” Its page on the score itself says that “Quality Score is not an input in the ad auction”, and that it “is not a key performance indicator and should not be optimized or aggregated with the rest of your data.” A third page connects them: “The real-time evaluations of these three components are used in the ad auction, while your Quality Score itself is not.” Brad Geddes made the same distinction for Adalysis in 2017, separating the visible score from the auction’s quality evaluation.
The question has also been measured. Navah Hopkins charted average CPC by Quality Score across 63,000 accounts for Search Engine Journal in 2019, with and without branded campaigns. Virtual Valley’s Quality Score data study in 2022 plotted average CPC for each score across 725 accounts and 192,603 keywords, found what it called “something of an anomaly around 5-7”, and repeated the chart after “excluding very large accounts”. Uprise Up analysed 20,000 scored keywords in 36 of its Google Ad Grants accounts in 2024, and Lubble compared Quality Score with average CPC under match type filters in 2023. Melissa Mackey’s 2023 critique in Search Engine Land called the case built on the 2013 figures “a circular argument”.
Those studies answer a pooled question: what keywords with a given score cost across a dataset. A pooled chart mixes a $0.40 click in one market with a $40 click in another, so the shape it shows depends on which accounts hold which scores. Most published analyses we found report pooled charts; we did not find a distribution of within-account rank correlations across many accounts. Our own study of which Google Ads scores actually track results had to leave Quality Score out, because its columns were missing from 29 of 30 account exports. A newer source makes the narrower test possible.
A score is visible on 46.6% of served keywords, which carry 84.9% of the spend
The data is a snapshot of a managed Google Ads portfolio, with keyword settings pulled on 10 July 2026 and keyword performance by period. In January to June 2026, 38,409 keywords that were enabled at the snapshot served at least one impression across 64 accounts. 46.6% of them carried a Quality Score, and those keywords held 84.9% of their spend. In total, 54 accounts had scored keywords.
For the price comparison we used every keyword with a score and at least 10 clicks in the window, whatever its status at the snapshot, so that a cost per click is not a one-click accident: 5,529 keywords in 52 accounts, carrying $1.51M of spend and 1.21M clicks. The within-account test needs enough keywords per account, which leaves the 23 accounts holding at least 30 of them.
Two timing and scope facts shape everything that follows. The score is the July snapshot, and the prices are the six months before it; this export holds no daily history of the score, so a keyword whose score changed in spring is compared at its July value. And Google’s page says that “Quality Score is based on historical impressions for exact searches of your keyword”, with each component compared against other advertisers “over the last 90 days”, while the CPC we measure covers every search the keyword served on across six months.
Inside the account, the median association with CPC is near zero, and accounts scatter widely
For each of the 23 accounts, we ranked the qualifying keywords by Quality Score and by CPC and measured how closely the two rankings agree. The measure is Spearman’s rank correlation: 1 means the two orders are identical, 0 means no monotonic association, and −1 means one order is the reverse of the other. If higher displayed scores were consistently associated with lower observed CPC across these keywords, most accounts would come out negative.
The median across the 23 accounts is 0.061, with the middle half of accounts between −0.142 and 0.205. The spread matters as much as the middle: individual accounts range from −0.661 to +0.641, with 9 negative and 14 positive. Leaving any single account out keeps the median between 0.055 and 0.091. In some accounts, higher-scored keywords were cheaper; in others they were dearer; the median account shows almost no ordering either way.
A result like this could simply mean the score is noise in this export. So we ran the same test against a metric the score is built to reflect. Expected click-through rate is one of its components, and on the same keywords, in the same accounts, the median rank correlation between Quality Score and actual click-through rate is 0.296, positive in 20 of 23 accounts. The median association is clearly stronger with click-through rate than with CPC.
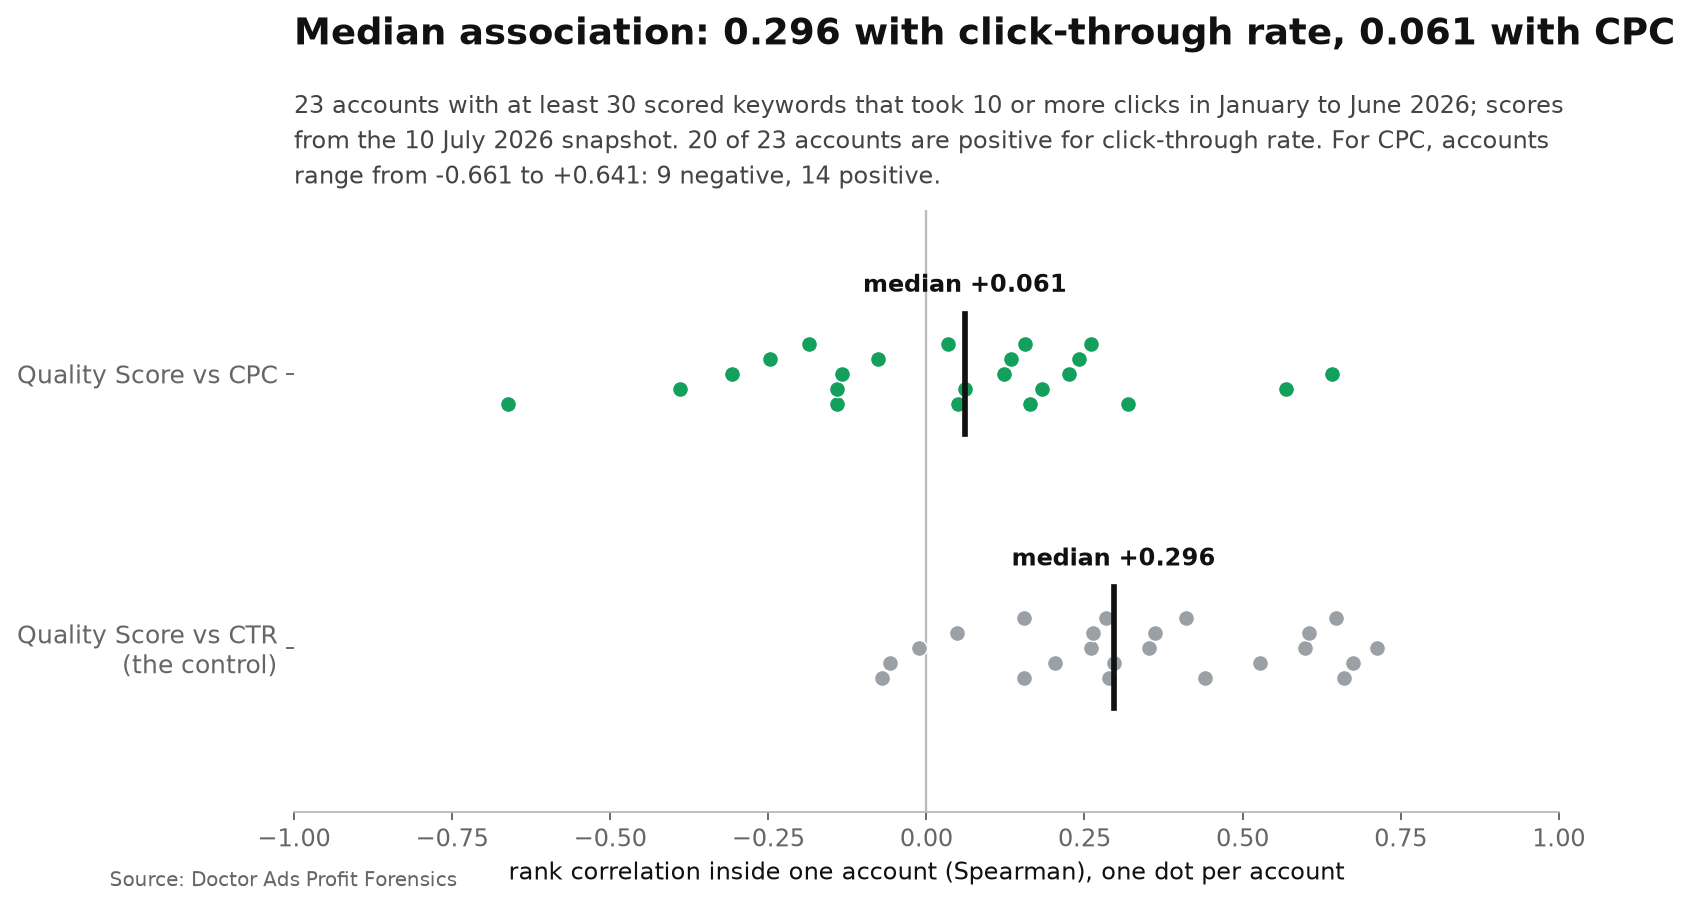
Several checks move the picture little. With at least 30 clicks per keyword, the median is −0.048 across 15 accounts. Against 2025 prices it is 0.062 across 19 accounts, although an older window cannot tell us how scores changed over time. Against conversion rate it is 0.098 across 22 accounts. Restricted to exact match keywords, where the searches behind the score and the price overlap most, the median is 0.073 across only 8 accounts, with a leave-one-account-out range of −0.006 to 0.152: exploratory, and not different in kind.
Account-normalised CPC shows no consistent downward pattern by score
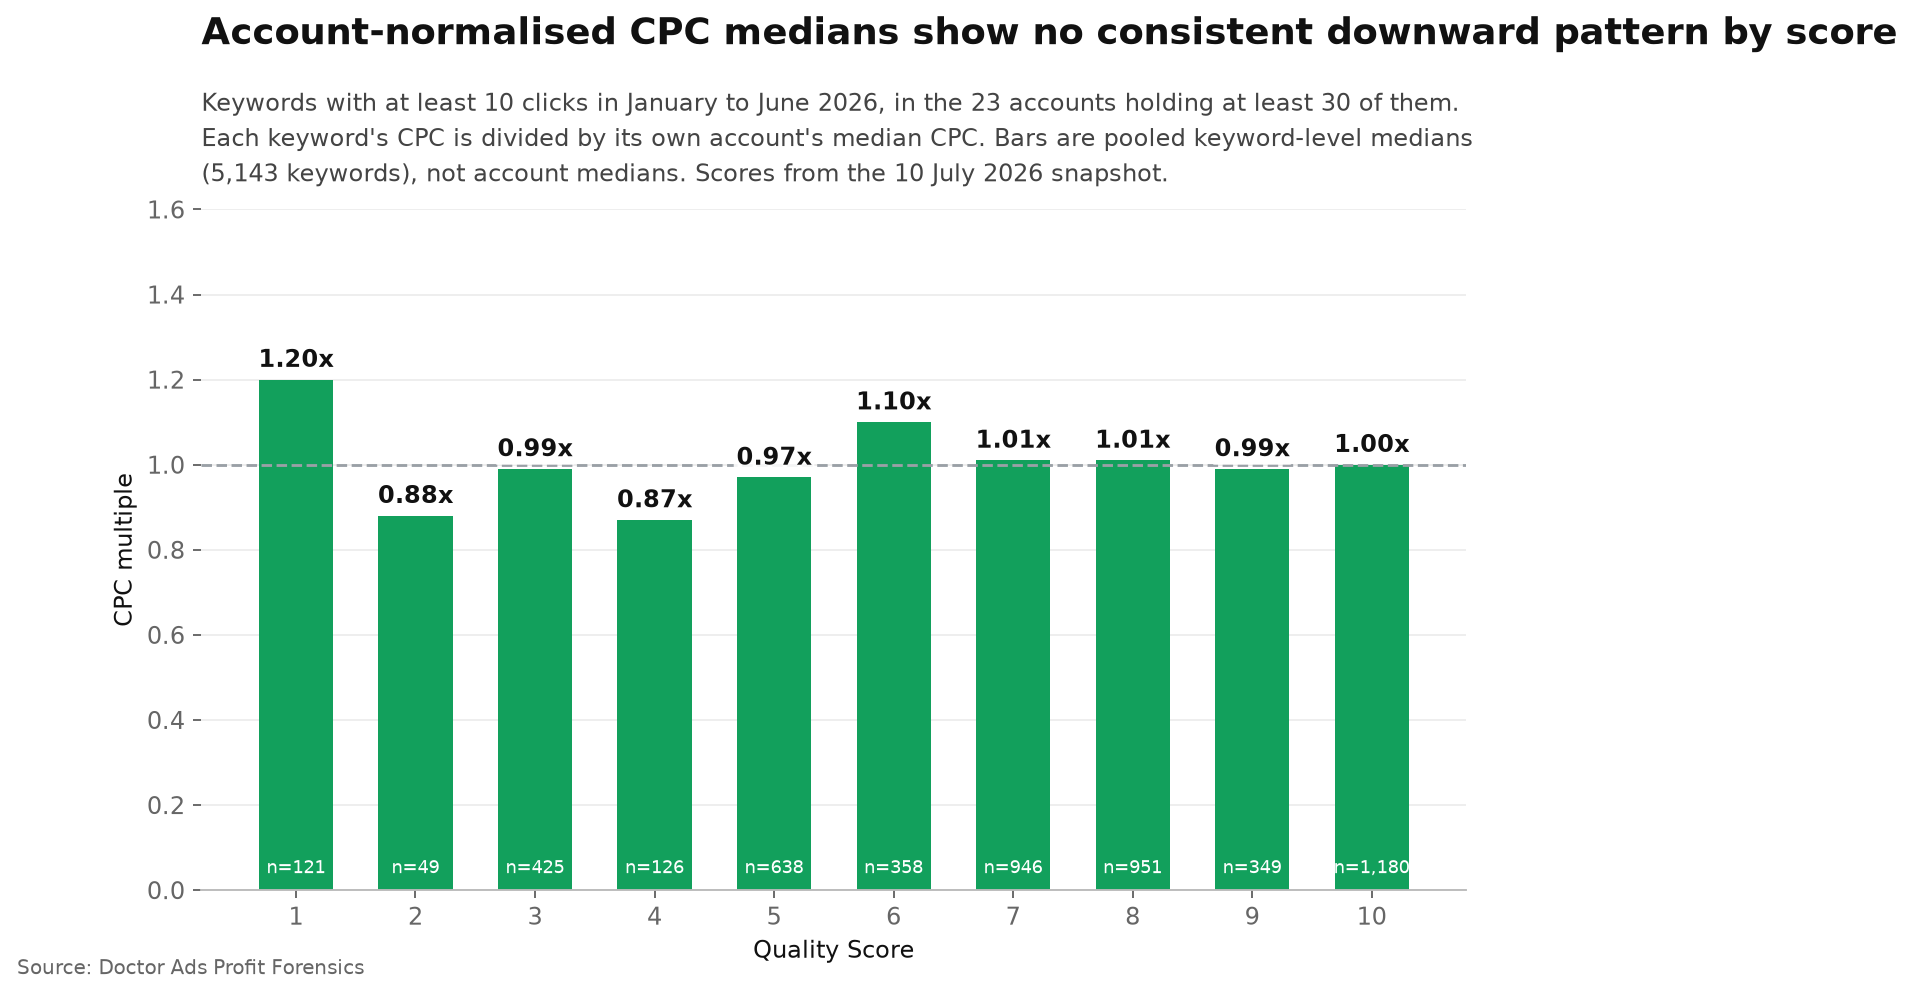
A second view looks at shape rather than ordering. We divided each keyword’s CPC by its own account’s median CPC, so that 1.00x means “priced like the typical qualifying keyword in this account”, and took the median of that multiple at each score across the pooled keywords of the 23 accounts: 5,143 keywords. These are keyword-level medians, not account medians, and thinly populated scores lean on few accounts.
The medians run from 0.87x at score 4 to 1.20x at score 1, with no consistent downward pattern as the score rises. Keywords scored 10, 1,180 of them from 18 accounts, sit at 1.00x. Scores 7 and 8 sit at 1.01x and score 5 at 0.97x.
The same question account by account: in each account with at least five keywords on each side, we divided the median CPC of keywords scored 8 to 10 by the median CPC of keywords scored 1 to 6. Across 19 accounts the median ratio is 1.12, with the middle half between 0.84 and 1.29. High-scored keywords had the lower median CPC in 7 of 19 accounts, and one account showed a ratio at or below half.
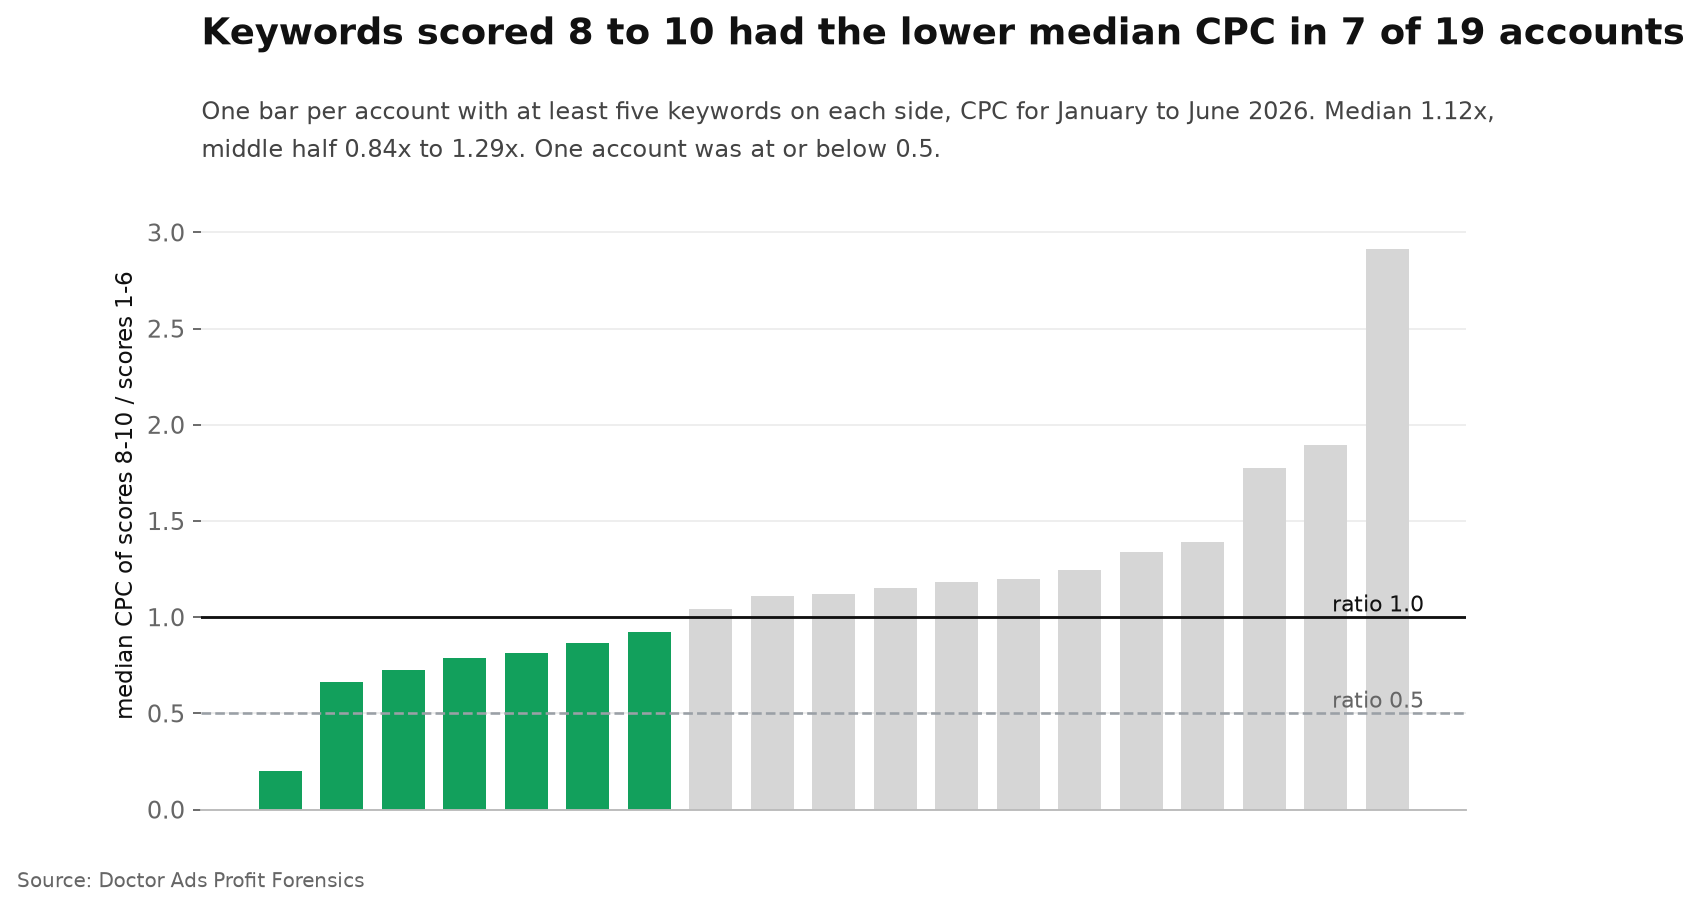
We are calling this Flat Median, Scattered Accounts. The median account shows almost no price ordering by score, and the accounts around it point in both directions.
Exploratory: score 10 against score 5 in 8 accounts
The table is written against one specific pair, so we also compared it directly, as a descriptive check rather than an answer to the auction problem below. In every account holding at least five keywords scored 10 and five scored 5, we divided the median CPC of the first group by the median CPC of the second. Only 8 accounts qualify, so this is exploratory.
The median ratio is 0.88, with the middle half from 0.69 to 1.14, and leaving one account out keeps it between 0.84 and 0.93. Score 10 had the lower median CPC in 5 of 8 accounts, and none of the 8 reaches the 0.50 the table gives for this pair. With three keywords on each side, it is 0.89 across 10 accounts, again with none at half. Score 10 against scores 1 to 4 gives a median of 0.75 across 9 accounts, lower in 5 of them. Auction conditions are not held constant in any of these comparisons.
What this comparison can and cannot say
Ad Rank is calculated “based on several factors, including your competition, the context of the person’s search, and your ad quality at that moment.” Two keywords with the same displayed score can sit in completely different auctions: different searches, different rivals, different bids set by Smart Bidding. A genuine price advantage from quality can coexist with a positive correlation across keywords, if higher-scored keywords tend to enter more expensive auctions. Comparing keywords with each other cannot separate those effects.
Holding the ad group constant does not solve it either. Of 252 ad groups with at least five qualifying keywords, the correlation is defined in 244; their median is 0.004, and 108 of them are negative. Keywords in one ad group share ads and a landing page, but not searches or competitors.
So the claim this data supports is narrow. In these accounts, July’s displayed scores showed little monotonic association with the CPC keywords paid in the months before, and the association varied widely from account to account. It does not show that improving ads or landing pages leaves your price unchanged, and it is not a test of how well the score predicts future prices.
Where the below-average ratings sit
The score’s breakdown is where Google points advertisers. Among the 18,199 keywords with a score and impressions in January to June 2026, landing page experience is rated below average on 37.0%, expected click-through rate on 27.4% and ad relevance on 18.2%. Weighted by spend inside each account, the order holds: in the median account among the 38 with at least $1,000 of scored spend, below-average landing page ratings cover 21.3% of scored spend, expected click-through rate 11.2% and ad relevance 8.0%. These figures describe how often each rating appears, not what fixing it would return.
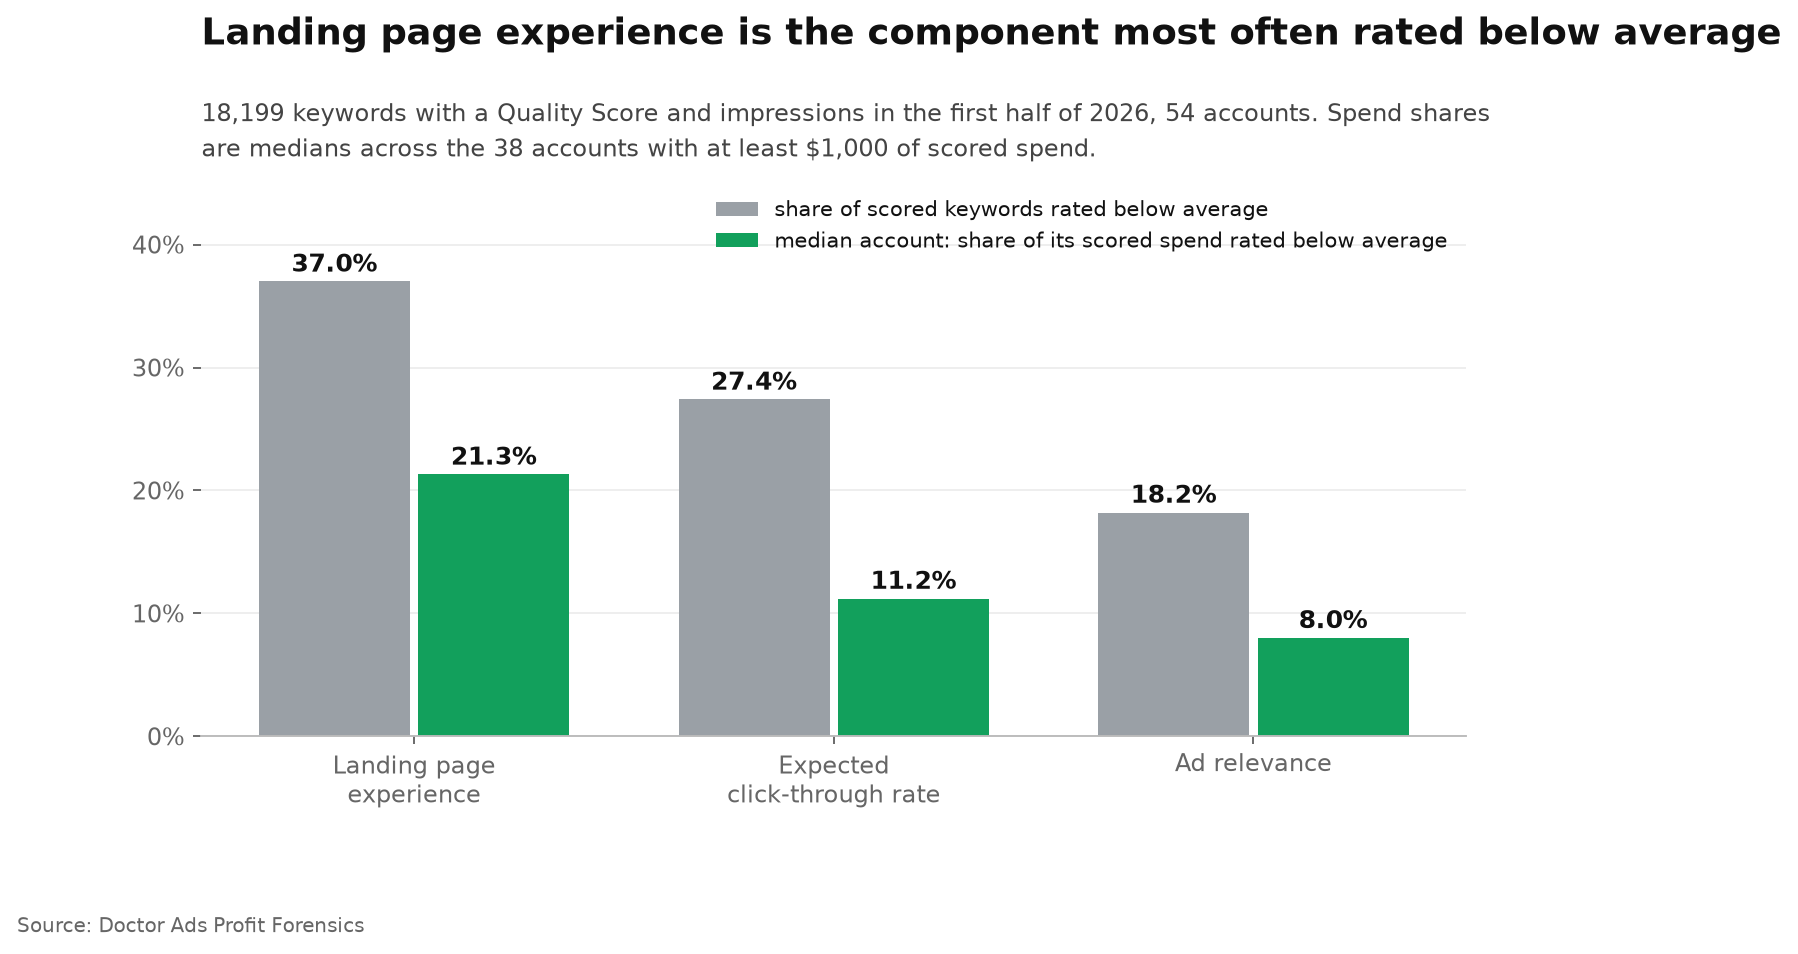
Pooled across the portfolio, keywords scored 7 to 10 hold 83.8% of scored spend, but a single account holds 57.3% of that spend, so the pooled figure mostly describes one account. Inside the median account, keywords scored 1 to 6 carry 35.0% of scored spend, with the middle half of accounts between 6.3% and 73.8%.
When this does not apply
You are tracking one keyword over time. This study compares keywords with each other. If a landing page change was followed by a lower CPC on the same keyword, that is a different design, and nothing here contradicts it, although other things may have changed at the same time.
Your account has few keywords with real traffic. Accounts with fewer than 30 keywords taking 10 or more clicks were not part of the within-account test. With a handful of keywords, a correlation is mostly noise, in either direction.
Most of your spend has no score. Here, keywords with a visible score carried 84.9% of the spend of enabled keywords that served. If that share is small in your account, the score describes a minority of your money.
What to do with the score
- Treat the 1 to 10 number the way Google’s own page describes it, as a diagnostic tool rather than a cost lever or a KPI.
- Sort keywords by cost and read the three component ratings on the keywords that matter commercially, rather than an account-wide average score.
- Do not assume one universal first fix. In this portfolio landing page experience was the most frequent below-average rating, which says where ratings cluster, not where the payoff is.
- To estimate what a quality change does to price, use a controlled experiment with a comparison group. A before and after on one keyword is monitoring, not an estimate, because auctions and bids move at the same time.
Key takeaways
- The widely reprinted table is a formula lineage: Click Equations in 2009 against a score of 7, rebased by Larry Kim to 5 in 2013. Pooled empirical charts exist, across 63,000 accounts in 2019 and 725 accounts in 2022.
- Inside 23 managed accounts, the median rank correlation between Quality Score and CPC is 0.061, and accounts range from −0.661 to +0.641.
- The same scores show a median correlation of 0.296 with click-through rate, positive in 20 of 23 accounts.
- Account-normalised CPC medians run from 0.87x to 1.20x across the ten scores, with no consistent downward pattern.
- Exploratory, 8 accounts: score 10 against score 5 gives a median CPC ratio of 0.88, with no account at half.
- All of these compare a July 2026 score with January to June 2026 CPC across keywords that face different auctions. They are associations, not a test of what raising a score does to price.
Researcher’s take
Teams still report an average Quality Score as if it were a cost lever. In these accounts the displayed score lined up with click-through rate far more than with price, and its relationship with price pointed in different directions in different accounts. My reading, and it is a reading rather than a finding, is that the score works better as a diagnostic of how ads engage searchers than as a guide to what a click will cost, and that the answer differs from one account to the next. What I would do: stop reporting the average score, read the component ratings on the keywords that carry the money, and test changes against a comparison group.
Igor Ivitskiy, Doctor Ads
Method
Data statement v.2026.09. Source: keyword settings and keyword performance for a managed Google Ads portfolio analysed by Doctor Ads Profit Forensics, settings snapshot dated 10 July 2026, performance for January to June 2026, with 2025 used as a robustness window. Costs are normalised to USD. Unit of analysis is one keyword in one period. Accounts are pseudonymised, and no keyword text, ad group, campaign or vertical name is published.
Populations. Coverage figures use keywords enabled at the snapshot that served in January to June 2026: 38,409 keywords in 64 accounts. The component figures use all 18,199 keywords with a score and impressions in the window, regardless of status. The price comparisons use the 5,529 keywords with a score and at least 10 clicks, regardless of status, in 52 accounts; the within-account tests use the 23 accounts holding at least 30 of them.
Definitions. Cost per click is cost divided by clicks for the window. Rank correlation is Spearman’s, with average ranks for ties, computed separately in each account. The within-ad-group test uses the 252 ad groups holding at least five qualifying keywords; the correlation is defined in 244 of them, and the 21 accounts with at least three such ad groups have a median of 0.056. Score-group ratios compare median CPCs inside an account, with at least five keywords on each side unless stated. The CPC index divides each keyword’s CPC by its account’s median CPC and reports the pooled keyword-level median per score, 5,143 keywords.
Weighting. Correlations and ratios are reported as medians across accounts, with the middle half and leave-one-account-out ranges. The CPC index is a pooled keyword-level median, not an account median. Pooled spend figures are flagged with the share of the largest account, 57.3% of scored spend. Medians and quartiles use linear interpolation, and the rank correlation was cross-checked against an independent implementation.
Robustness. A 30-click threshold gives −0.048 across 15 accounts. 2025 prices give 0.062 across 19 accounts. Exact match keywords only give 0.073 across 8 accounts. Conversion rate gives 0.098. Leave-one-account-out ranges are reported for every account median.
Selection note. Agency-managed portfolio, not a random sample of advertisers, and limited to accounts with enough scored traffic to enter each test.
Limitations. Five. Keywords face different auctions and bids, and no design here holds them constant, so nothing on this page is causal. The score is a July snapshot compared with earlier prices, and the export holds no score history. The score reflects exact searches while the CPC covers all searches the keyword served. A score is visible on 46.6% of the enabled keywords that served. The score 10 against 5 comparison rests on 8 accounts.
Changelog. First published September 2026. Recomputed quarterly against the live claim registry.
What to read next
- Which Google Ads score actually tracks results, the study that could not test Quality Score and left the gap this page addresses.
- Where your Google Ads impressions actually go, on how much lost impression share comes down to rank rather than budget.
- How broad match share moved inside the same portfolio, where a flat median also hides movement.
- The pooled view: Virtual Valley’s Quality Score data study across 725 accounts.


