

The short version. Optimization score is the number Google puts at the top of your account, and the number agencies quote in status calls. We took 6,071 campaigns carrying a real score across accounts in the Doctor Ads Profit Forensics portfolio, $85.3M of spend, and asked one question the public studies skip: inside a single account, does the score rank campaigns the way their actual results rank them?
- It does not, at portfolio level. Ranking each account’s campaigns by score and by click-through rate gives a median rank correlation of 0.05 across qualifying portfolio accounts (middle half: -0.22 to 0.21). For conversion rate the median is -0.05 across the accounts qualifying for that measure.
- Individual accounts are not uniform, and that matters more than the median: 11.5% of the qualifying accounts sit at 0.5 or stronger, two thirds of them negative. There is no portfolio-wide direction to carry into your account.
- This is not a contradiction of the known cross-account result. Optmyzr measured 17,380 accounts and found that high-scoring accounts beat low-scoring ones on ROAS by 186%, with no correlation to CTR. That compares accounts. We compare campaigns inside one owner’s account.
- A second explanation deserves equal billing: half of all campaigns sit inside a 23-point band of score, so there may be very little left for a ranking to work with.
- Managed portfolio, one export per account, click-through and conversion rate only.
What optimization score is actually built from
Google’s own definition is one sentence: optimization score is “an estimate of how well your Google Ads account is set to perform”. Scores run from 0 to 100%, and the help centre is careful about the verb. Not how well it performs. How well it is set to perform.
The distinction is in the mechanics. The score is computed in real time from your statistics, your settings, the status of the account, the relevant impact of the recommendations currently available to you, and your recent history of accepting or dismissing them. In the Google Ads API the score and the recommendation list are two faces of one object: apply a recommendation and the score moves, dismiss it and the score also moves, because dismissal removes the recommendation from the pool.
So the number answers a question about configuration. The interesting question is empirical: how closely does configuration track outcome in a live account?
The question the public studies do not ask
There is one serious public dataset on this, and it deserves to be quoted before anything else. Optmyzr looked at 17,380 accounts spending between $500 and $1M a month and found a real cross-account pattern: accounts scoring 90 to 100 beat accounts scoring under 70 on ROAS by 186%. They also found no correlation between the score and CTR, and they were explicit that causation was not established: an actively managed account plausibly earns both the higher score and the better results.
That is a study of accounts against other accounts. It answers “do well-run accounts have higher scores”, and the answer is yes.
The question an owner actually faces is different, and it lives one level down. You have your account, your economics, your manager, your conversion event. Google shows a score per campaign. Within your own account, does that score tell you which of your campaigns is working?
To be fair to Google before measuring: they never promised it would. The help centre says “set to perform”, the score is documented as a function of settings and recommendations, and nothing in it claims to rank your campaigns by results. But that is not how the number is used. It is used as a per-campaign quality reading in agency reports, in status calls and in the column advertisers sort by when deciding where to spend an afternoon. Testing a metric against the job people actually give it is fair even when the vendor scoped it more narrowly, as long as the scoping is stated. It is stated.
We could not find that measured anywhere in public, so we measured it ourselves. Plenty of practitioners argue the score is a vanity metric; what is missing is the number. The design is deliberately narrow: every comparison happens inside one account, so the owner, the vertical, the conversion definition and the management style are held constant by construction. Nothing is pooled across accounts except the coefficients themselves.
One thing to know about the raw data before the results. Google’s export writes a literal -- instead of a number for campaigns it does not score, and in this corpus 3,690 rows arrive that way. They are excluded everywhere, including from the population figures above: every number in this article describes the 6,071 campaigns that carry an actual score.
Rank by score, then rank by clicks: the orders do not match
For each account we ranked its campaigns by optimization score, ranked the same campaigns by click-through rate, and measured how well the two orders agree. A coefficient of 1.0 means perfect agreement, 0 means no relationship, -1.0 means perfect inversion.
Across qualifying portfolio accounts the median is 0.05. The middle half of accounts runs from -0.22 to 0.21, straddling zero. The extremes reach -0.58 and 0.51, in both directions.
Read that spread carefully, because it is not a uniform nothing. 11.5% of the qualifying accounts show a coefficient of 0.5 or stronger, and they point both ways: in about a third of those accounts the highest-scored campaigns are also the best-clicked ones, in two thirds the relationship runs backwards. What collapses is any rule you could carry from one account to the next. The portfolio has no direction; individual accounts sometimes do, and nothing here tells you in advance which kind yours is.
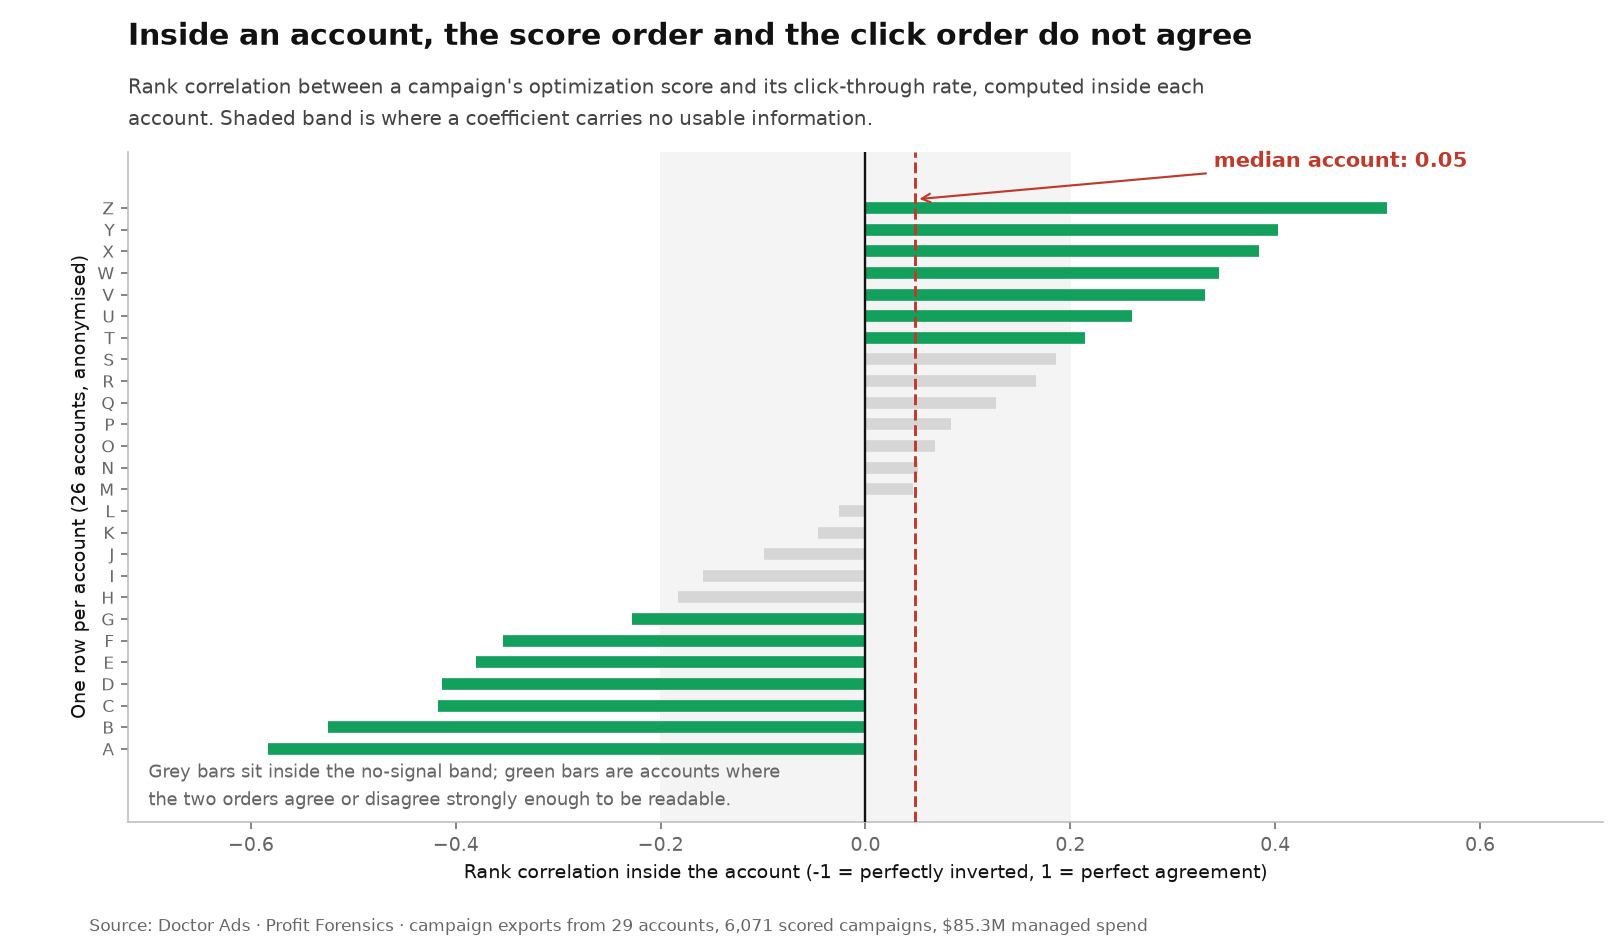
In 46.2% of the qualifying accounts, the coefficient sits inside plus or minus 0.2, the band where a rank correlation carries no usable ordering. About half the accounts lean positive, the rest lean negative.
Conversion rate gives the same answer, if anything a colder one
Click-through rate is the softest test available, because it is the metric closest to the ad itself. Conversion rate is the one owners care about, and here the corpus rule is strict: conversions mean different events in different accounts, so they are never pooled. Inside one account the comparison is clean.
Across qualifying portfolio accounts the median correlation between score and conversion rate is -0.05, with the middle half from -0.26 to 0.02. In 60.7% of accounts the coefficient sits inside plus or minus 0.2, and about a third of the accounts lean positive.
Read the sign carefully, because it is easy to over-read. A median of -0.05 is not evidence that a higher score makes a campaign convert worse. It is evidence that the score carries no usable information about which campaign converts better, with a faint tilt that could reverse on the next corpus.
The same result in the units of an account
Correlation coefficients are hard to feel, so here is the same data cut the way an owner would cut it: take the third of the account’s campaigns with the highest optimization score, and see where they land when the account is sorted by click-through rate.
The median account puts 50.0% of them in the bottom half, against a null expectation of 50.1% for this way of slicing. Treat that as inconclusive rather than as a result: it is the same nothing as the correlation, expressed differently.
This particular cut comes with a caveat we would rather publish than hide. Scores repeat: many campaigns in the same account share an identical score, and how you break those ties moves the number. Resolving ties in the least flattering way gives a median of 60.4%; in the most flattering way, 41.7%. That corridor is 19 points wide and straddles the null, so the honest statement is “somewhere between 42% and 60%, depending on how ties are broken”. We report the neutral tie-break for completeness and treat the metric as an illustration of the correlation result, never as a finding of its own.
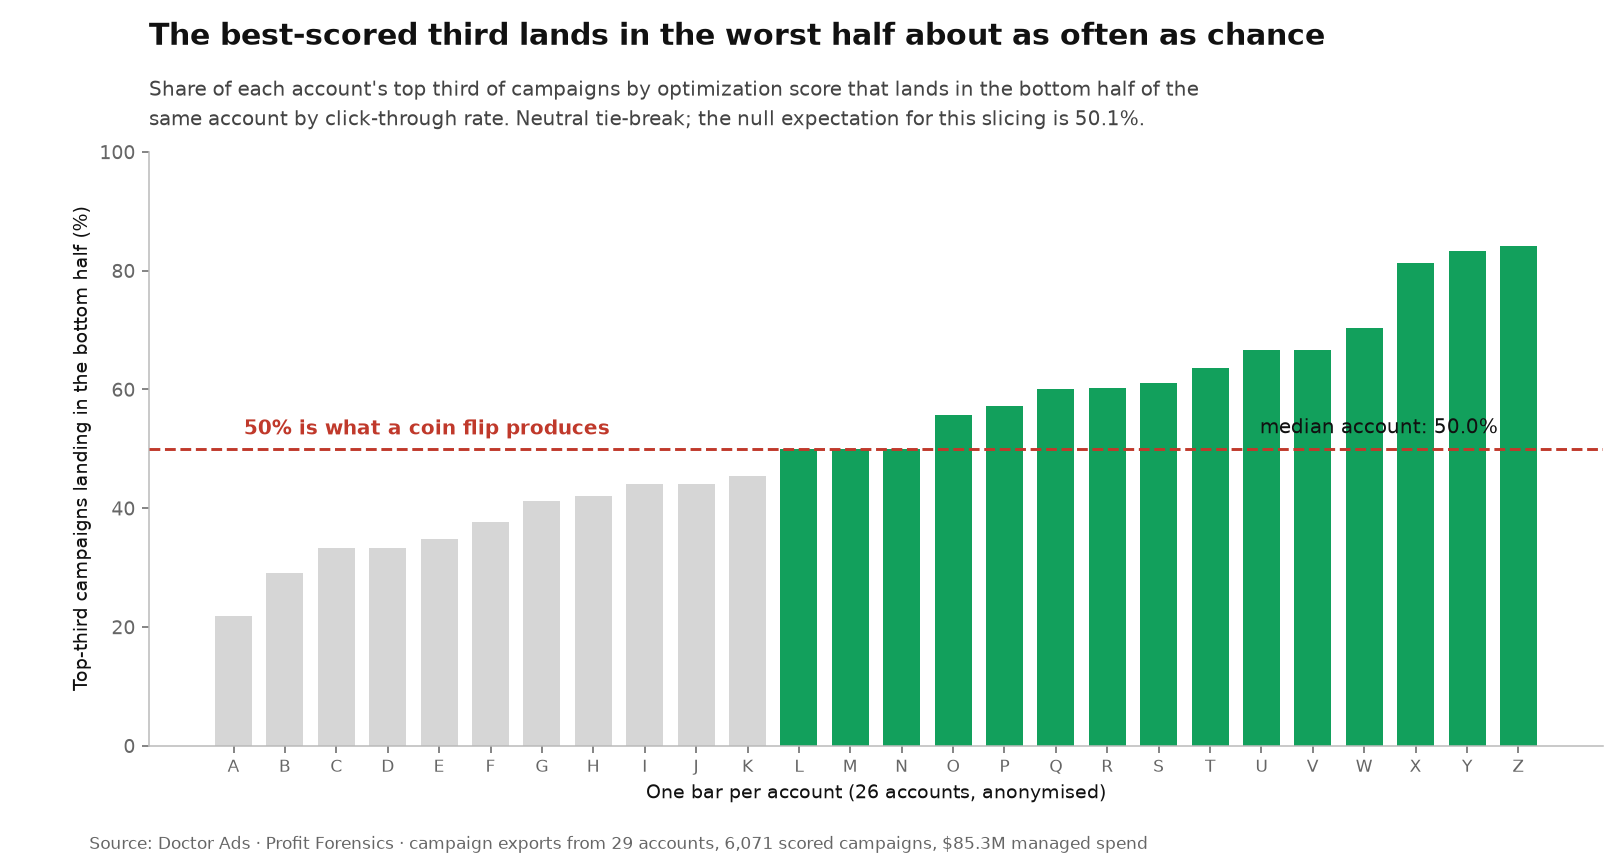
We call the shape the Score-Rank Gap, and it means one thing only: inside the account where the decision gets made, the score order and the outcome order are unrelated at portfolio level.
Three ways this could be wrong, and what happened when we checked
A null result is easy to manufacture by accident, so each of the obvious ways to fake one was checked before publication.
One account carrying the result. Removing any single account, one at a time across the whole portfolio, leaves the median at 0.05 for click-through rate throughout (full range across those runs: 0.046 to 0.052) and at -0.05 for conversion rate (-0.053 to -0.052). No single account moves the answer at the precision anyone would act on.
Mixed campaign types hiding the signal. Search and Demand Gen have entirely different click-through levels, and blending them could smother a real relationship. Restricted to search campaigns only, the median correlation is 0.05 for click-through rate and -0.05 for conversion rate. Worth noting how little this test had to do: among campaigns that carry a real score, 82.8% are search and only 9.8% are Demand Gen, so the mix was never doing much smothering in the first place.
Small accounts outvoting large ones. Every figure above counts each account once. Weighting by spend instead gives an average coefficient of -0.07 for click-through rate and -0.12 for conversion rate, against equal-account averages of -0.01 and -0.12. All four sit within a whisker of zero.
| Test | Click-through rate | Conversion rate |
|---|---|---|
| All campaigns, median across accounts | 0.05 | -0.05 |
| Search campaigns only, median across accounts | 0.05 | -0.05 |
| Median with any one account removed (29 runs) | 0.046 to 0.052 | -0.053 to -0.052 |
| Average across accounts, counted equally | -0.01 | -0.12 |
| Average across accounts, weighted by spend | -0.07 | -0.12 |
Two explanations, and the honest one is not the dramatic one
None of this makes the score broken, and there are two different reasons it could produce a flat result. They are not equally flattering to us, so both go here.
Explanation one: the score measures configuration, and configuration is not outcome. The number rises when you accept recommendations and when your settings match Google’s current model of a well-built account. Both correlate with an account having an attentive owner, which is the mechanism the cross-account result is consistent with: an owner who applies recommendations, watches budgets and prunes dead campaigns tends to end up with a higher score and better results. Inside that one owner’s account every campaign shares the same attentiveness, and what remains varying is offers, audiences, seasonality and creative.
Explanation two: there is barely anything to rank. The scores in this corpus are compressed near the top. Half of all campaigns sit inside a 23-point band, between 74.6% and 97.1%, and account-level medians run from 52.5% to 100%. A rank correlation cannot find order in a quantity that hardly varies, and managed portfolios like this one live exactly in that narrow high band. On this reading the score is not failing, it is saturated, and an account full of genuinely under-configured campaigns might behave differently.
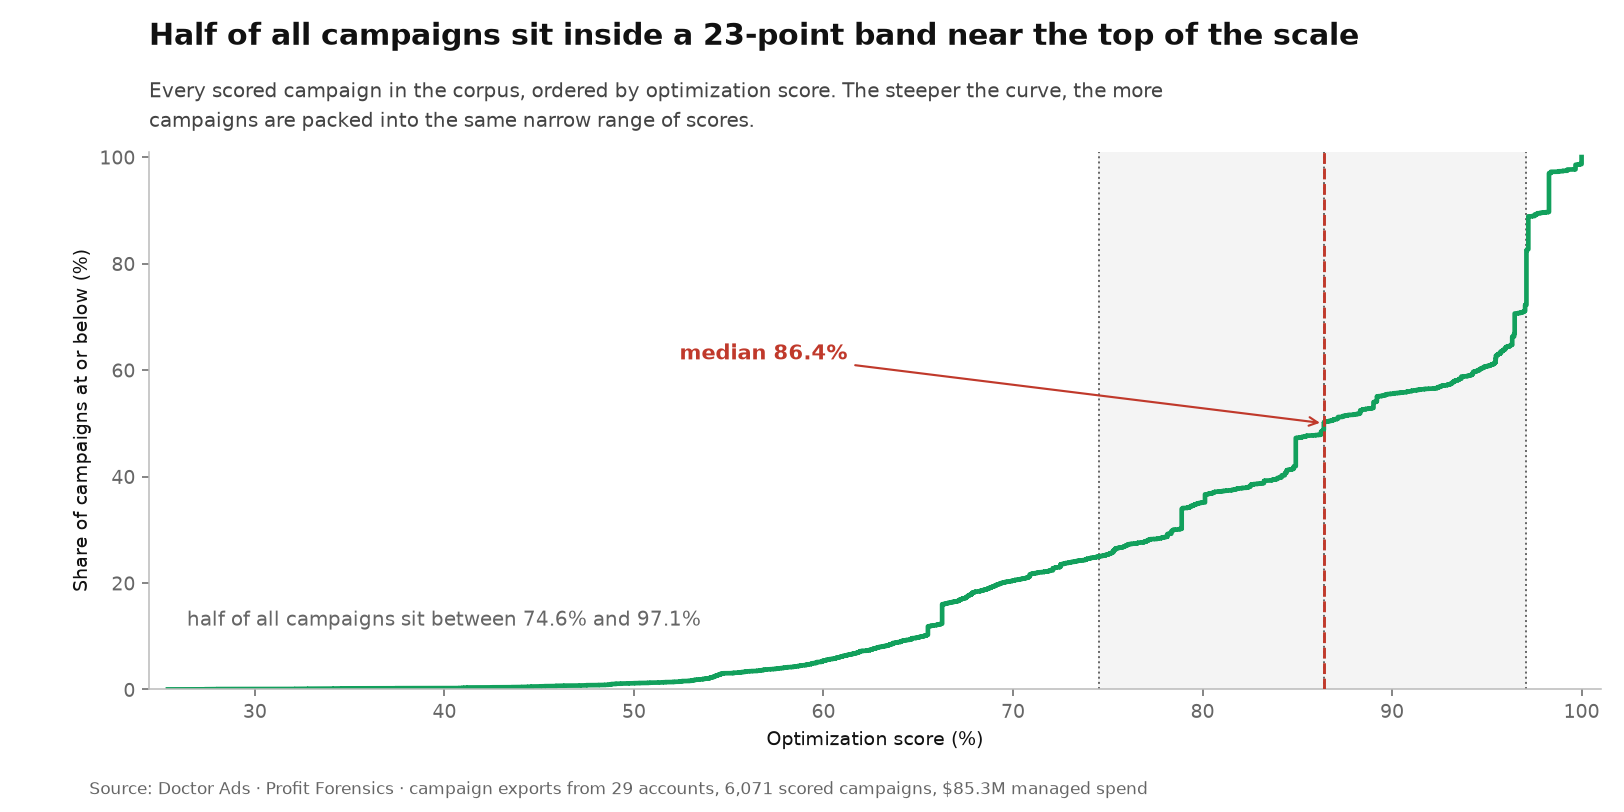
| Optimization score across 6,071 scored campaigns | Value |
|---|---|
| Lowest score in the corpus | 25.4% |
| Bottom quarter below | 74.6% |
| Median campaign | 86.4% |
| Top quarter above | 97.1% |
| Campaigns sitting exactly at 100% | 1.3% (80 campaigns) |
| Range of account-level medians | 52.5% to 100% |
We cannot separate the two explanations with these exports, and the difference matters for how far the result travels. What both share, and what the data do support, is the practical part: for an owner deciding which of their own campaigns to open first, the score does not carry the answer.
What to rank campaigns by instead
The replacement is not exotic, and it is already in your account.
Rank campaigns by share of spend that produced zero conversions in the window, by cost per conversion against the account’s own median, and by impression share lost to budget versus lost to rank, which separates “cannot afford it” from “not competitive enough for it”. Those three orders disagree with each other in useful ways, and each one points at a decision. We did not test them against the score in this study; we are telling you what we use, not presenting a measured winner.
Use the score for what it demonstrably is: a configuration reading and a change detector. In our own account management it earns its keep exactly there: a campaign whose score falls sharply from one week to the next has usually had something change underneath it, a disapproval, a budget cap, a broken conversion tag. That is a practitioner’s habit rather than a finding of this study, and we flag it as one.
This is the kind of question a Profit Forensics examination answers with your own numbers rather than a platform’s summary: which campaigns are actually carrying the account, and which are being flattered by a metric that never looked at the outcome.
The researcher’s take
Every platform eventually ships a number that fills the vacuum where judgment used to be, and this is that number. It is free, it sits at the top of the account, and Google calculates it for you. I have audited plenty of accounts where the score looked healthy and the spend did not, and the reason is duller than a conspiracy: the number was never built to answer the question people ask it. Sort your campaigns by the money they waste and by what they cost you against your own median. That ranking you will act on.
Method and sources
Doctor Ads Profit Forensics is the research desk of a Google Ads practice with 19 years and $770M managed spend behind it.
Data statement (corpus version 2026.07). Google Ads exports from 29 accounts in the Doctor Ads managed portfolio, one physical export per account. Campaigns qualify when they have impressions and a numeric optimization score: 6,071 campaigns, $85.3M of spend, 4.83 billion impressions, 149.9 million clicks. A further 3,690 rows carry the literal -- in the score column and are excluded everywhere, as are 276 rows with no click-through rate, which are dropped rather than counted as zero. An account enters the correlation analysis with at least five qualifying campaigns, which is 28 of the 29; the conversion-rate coefficient is defined for all 28 and the click-through coefficient for 26, because in two accounts one of the two quantities does not vary and a rank correlation is undefined rather than zero.
Selection note. These accounts arrived through audits and ongoing management, which skews the portfolio toward larger spend and toward e-commerce and subscription businesses. The result describes accounts of that profile. It is not a random sample of Google Ads advertisers, and the campaign mix, 82.8% search among scored campaigns, is a property of this portfolio rather than of the platform.
Measure. Spearman rank correlation between a campaign’s optimization score and its click-through rate, and separately its conversion rate, computed inside each account and then summarised across accounts by median and interquartile range, with percentiles interpolated in the ordinary way. Ties take average ranks. Conversion rates are never pooled across accounts. Robustness: full leave-one-account-out across 29 iterations, equal-account against spend-weighted aggregation, and a pre-registered counter-hypothesis (campaign-type mix) tested by restricting to search campaigns. The metric definitions and the kill condition, a median absolute correlation of 0.5 or more, were fixed in writing before the query ran.
Reconstruction. Pull campaign-level exports with optimization score, CTR and conversion rate for one export per account. Keep campaigns with impressions and a numeric score. Inside each account, rank and correlate. Report the distribution of coefficients, not their average.
Changelog. First publication, 2026-08-10. Sources: Google Ads Help on optimisation score, Google Ads Help on checking your score, Google Ads API recommendations documentation, Optmyzr’s 17,380-account study.
Limitations
- Rank, not effect. We measure whether two orders agree inside an account. Nothing here estimates what would happen if you applied or ignored a recommendation, and no causal claim is made in either direction.
- Two metrics, not all metrics. Click-through rate and conversion rate are tested. Cost per acquisition and ROAS are not; account-local versions of those coefficients could be computed on a later pass and are simply outside this study.
- A portfolio median hides account-level variety. Four accounts show coefficients of 0.5 or stronger. The claim is about the absence of a portable rule, not about every account.
- One snapshot per account. Optimization score is computed in real time and changes daily; each export is a single moment. A within-account time series would be a stronger design.
- Compressed range. With a median score of 86.4% and a quarter of campaigns above 97.1%, there is limited spread for any ranking to work with, and this alternative explanation is not ruled out.
- Managed portfolio. Self-selected accounts, larger than average, skewed by vertical.
Key takeaways
- Inside an account, the median rank correlation between campaign optimization score and click-through rate is 0.05 across 26 accounts; for conversion rate it is -0.05 across 28.
- Three accounts out of 26 do show a strong relationship, two of them negative. The portfolio has no direction you can borrow.
- The result survives removing any single account, restricting to search campaigns, and switching to spend weighting.
- Half the campaigns sit inside a 23-point band of score, which is a competing explanation for the flat result and is not ruled out.
- The known cross-account finding, high-scoring accounts outperforming low-scoring ones, is about which accounts are well managed, not about which campaign inside your account is working.
When this does not apply
If you manage many accounts and need one crude health signal to triage which client to open first, the score is defensible: that is the cross-account comparison where the public evidence supports it. If your account is new, tiny, or has three campaigns, ranking anything is noise and the score is as good as any other tiebreaker. And if a specific recommendation is obviously right, apply it because it is right, not because it moves the number.
Frequently asked questions
Is a 100% optimization score bad? No, and it is not good either. In this corpus 80 campaigns, 1.3%, sit exactly at 100%. A perfect score means one of two things that look identical from outside: Google currently has nothing to recommend, or everything it had to recommend has been applied or dismissed. Dismissal counts, which is why the number alone cannot tell you which case you are in.
What is a good optimization score? The question assumes the number is a target. Account-level medians in this portfolio range from 52.5% to 100%, and both ends contain accounts their owners are happy with.
Does ignoring recommendations hurt my account? Nothing measured here says so. Dismissing a recommendation removes it from the pool and lifts the score, which is a reason to be careful about reading the number as a report card either way.
Why do you measure inside accounts instead of across them? Because that is where the decision lives. Across accounts, differences in owner, vertical and conversion definition dominate; the manager deciding which of their own campaigns to fix has all of those held constant.


